This topic contains a solution. Click here to go to the answer
|
|
|

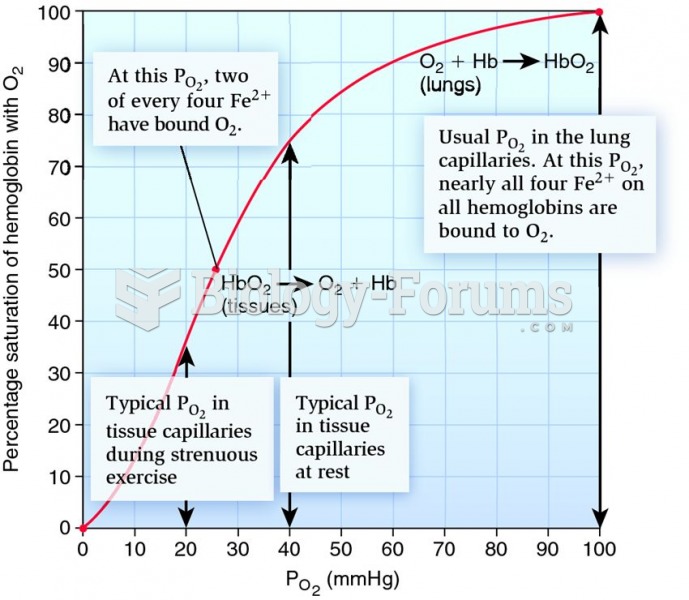 The human oxygen-hemoglobin dissociation curve.
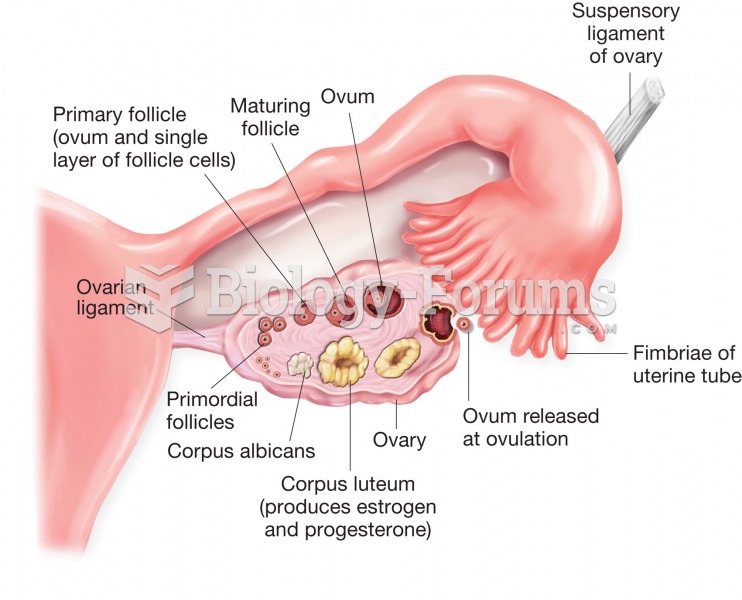 Structure of the ovary and uterine (fallopian) tube. Figure illustrates stages of ovum development a
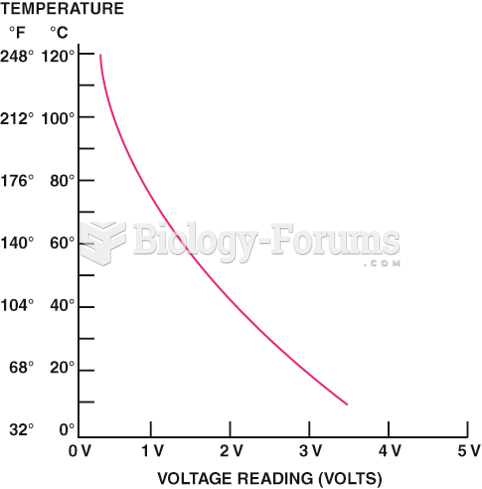 A typical ECT sensor temperature versus voltage curve.
 Who's Policing the Food Supply?
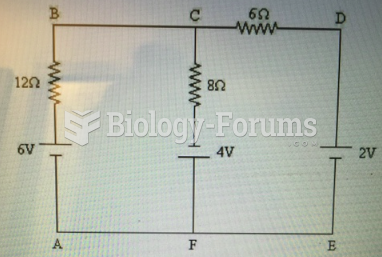 Identify the junction nodes in the circuit shown in Figure 21-1.
 Swimming Pool (Figure 3.1)