This topic contains a solution. Click here to go to the answer
|
|
|

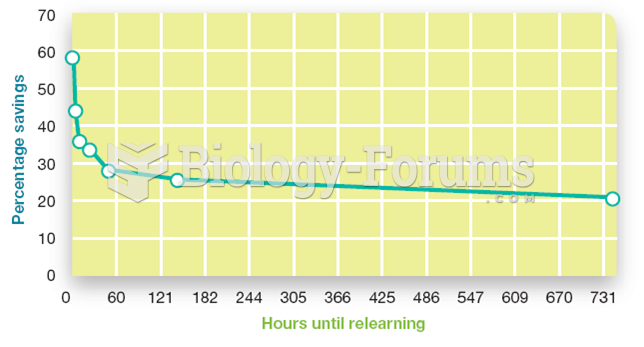 Ebbinghaus’s forgetting curve
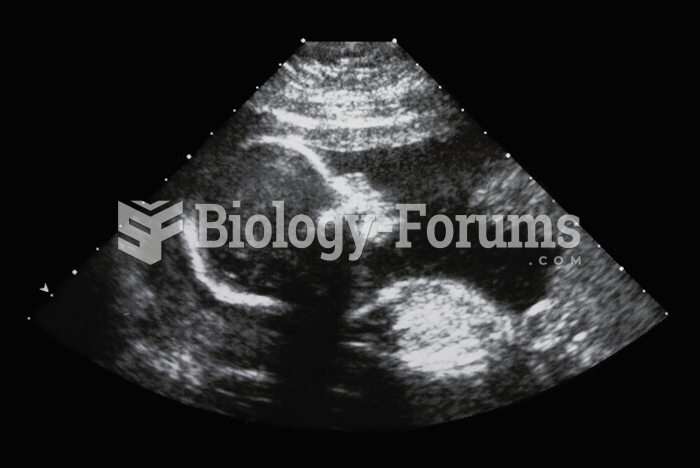 The photo shows an ultrasound image of a fetus of about 20 weeks’ gestational age.
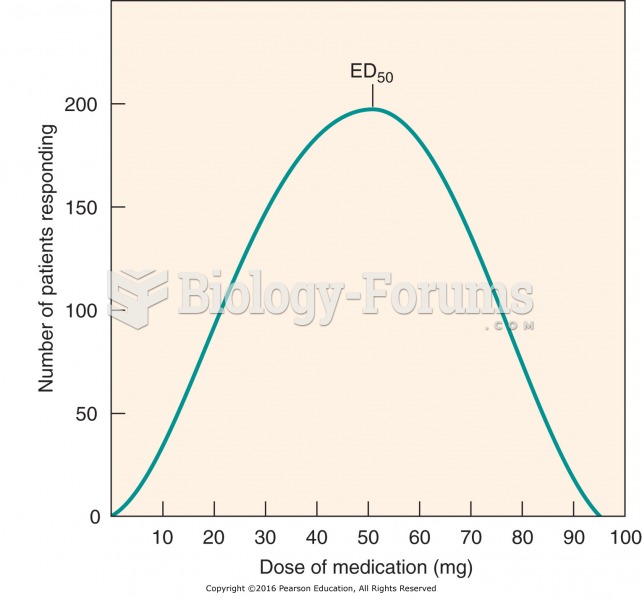 Frequency distribution curve: interpatient variability in drug response.
 Move joints in hands. Apply scissoring to metacarpals and figure-8s to fingers.
 Plan of Trajan's Forum and Market "خطة منتدى ترجان والسوق"
 Which reaction below represents Th decay by alpha emission?