This topic contains a solution. Click here to go to the answer
|
|
|

 Domestic cat
 Move joints in hands. Apply scissoring to metacarpals and figure-8s to fingers.
 Figure of a Woman with a Drawing Showing Evidence of Original Painting and Outlining Design Scheme
 Rice noodles are a good gluten-free substitute for pasta
 The Kuznets Curve
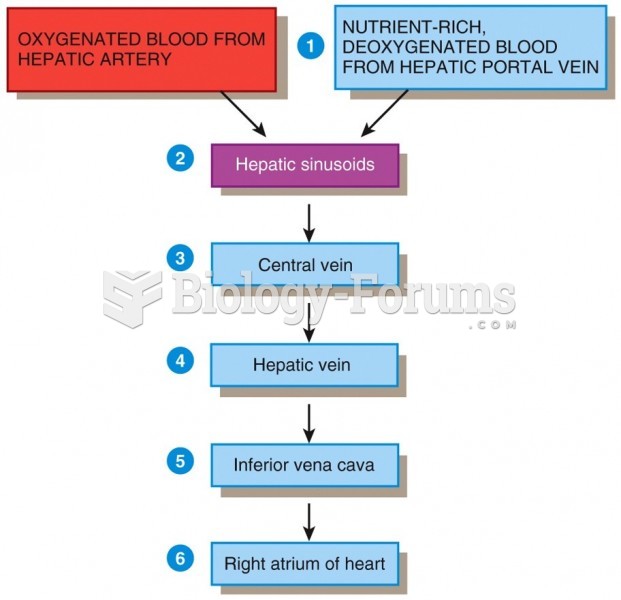 Blood Supply of the Liver