This topic contains a solution. Click here to go to the answer
|
|
|

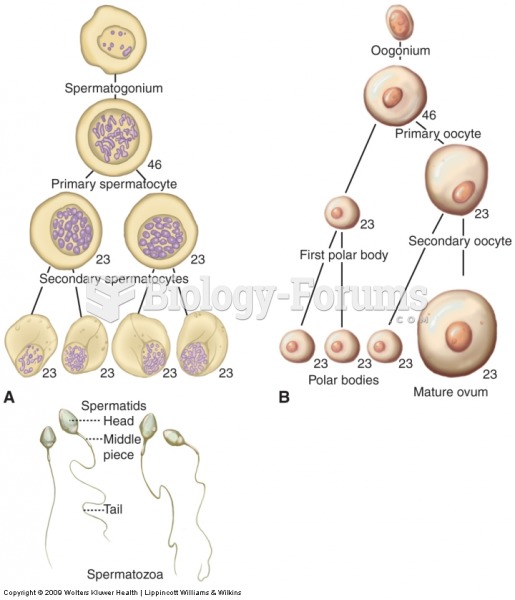 The formation of gametes by the process of meiosis is known as gametogenesis.
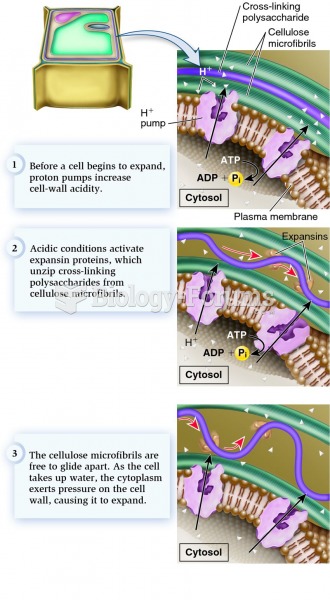 A hypothetical model of the process of cell-wall expansion.
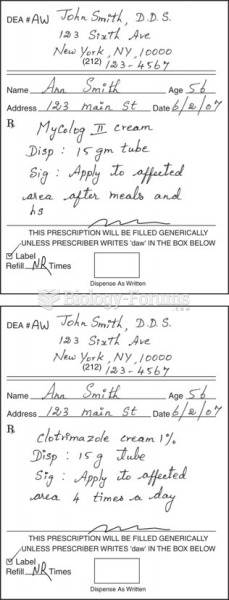 Sample prescriptions of drugs for oral fungal infections.
 Incineration Process
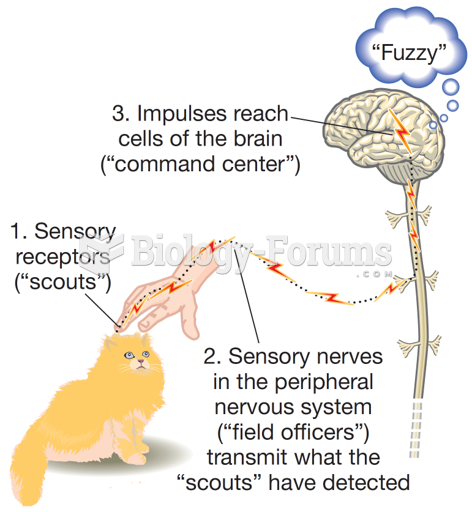 The General Process of Sensation
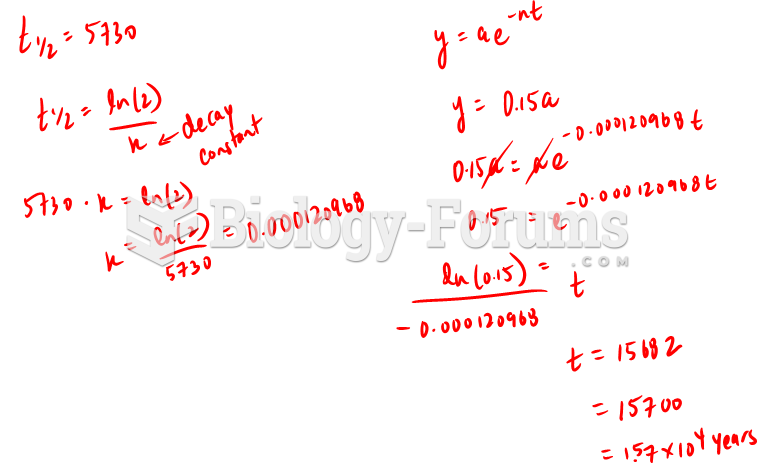 What is the estimated age of the archaeological sample