This topic contains a solution. Click here to go to the answer
|
|
|

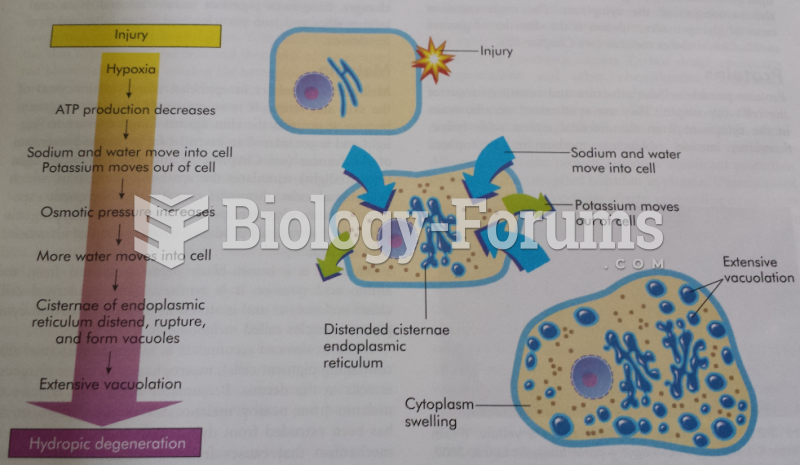 Oncosis Process
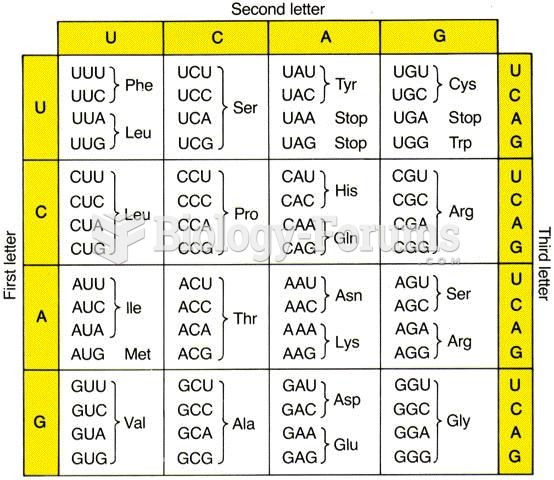 Codon Chart
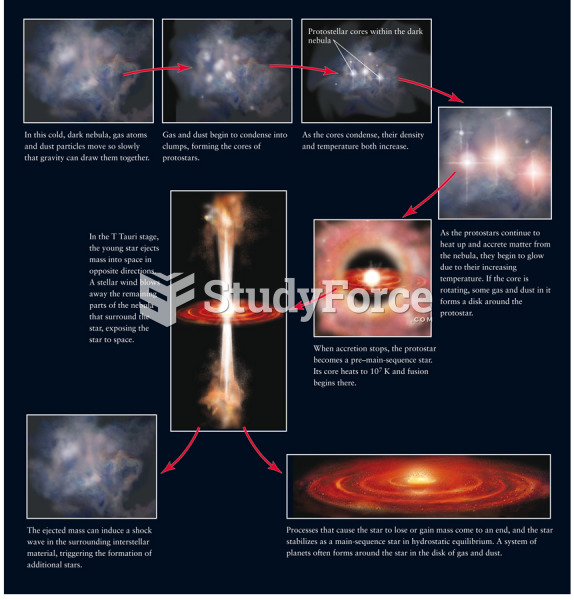 A Summary of the Star Formation Process
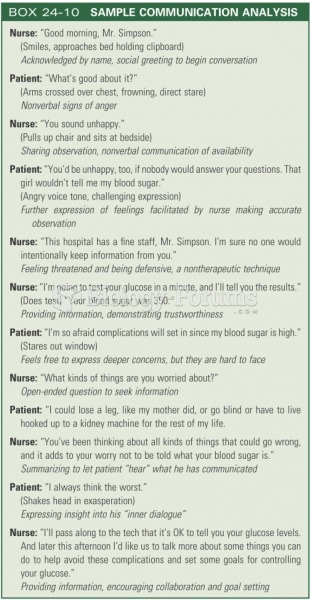 Sample communication analysis
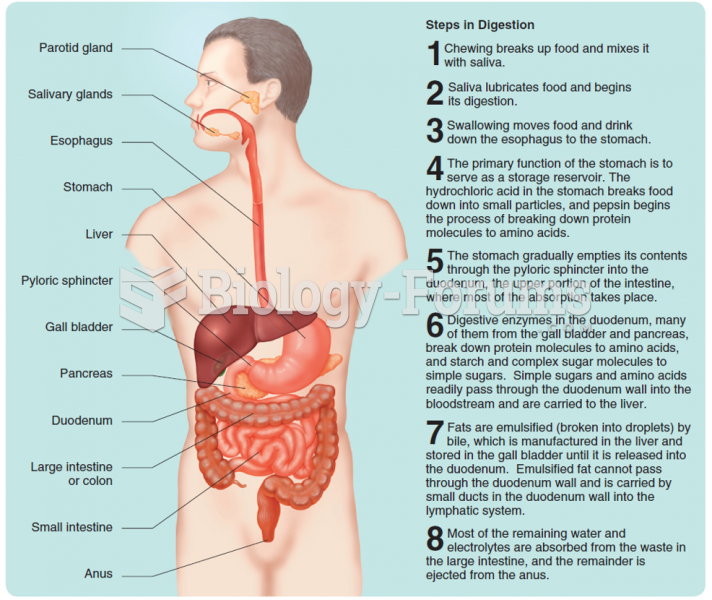 The gastrointestinal tract and the process of digestion.
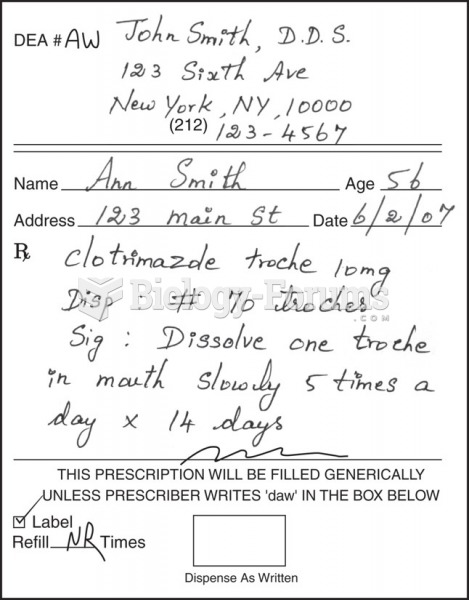 Sample prescriptions of drugs for oral fungal infections.