|
|
|

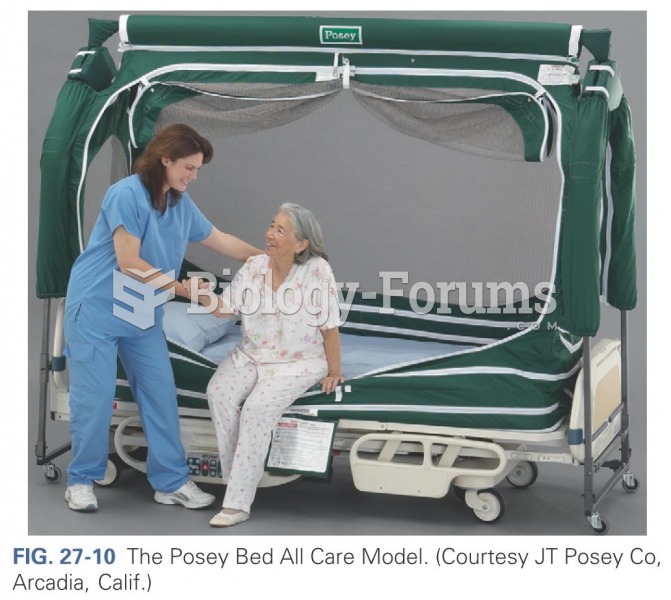 The posey bed care model
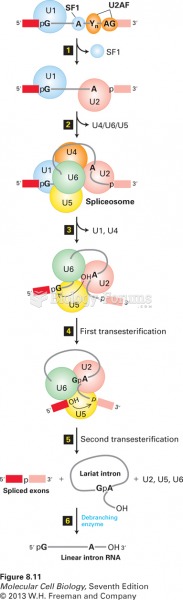 Model of spliceosome-mediated splicing of pre-mRNA
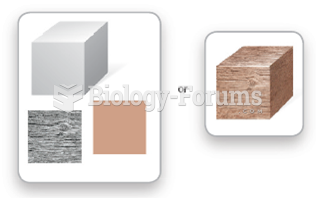 Working Memory Binds Visual Features into a Single Chunk
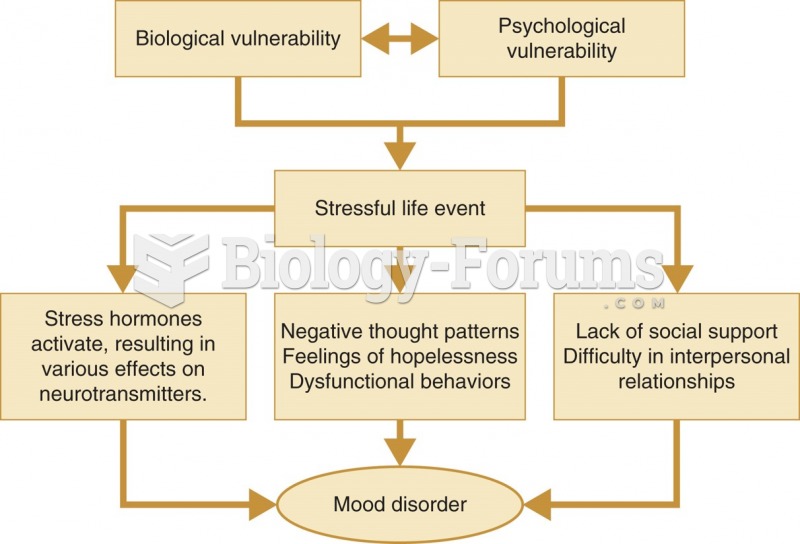 Diathesis–stress model of depression.
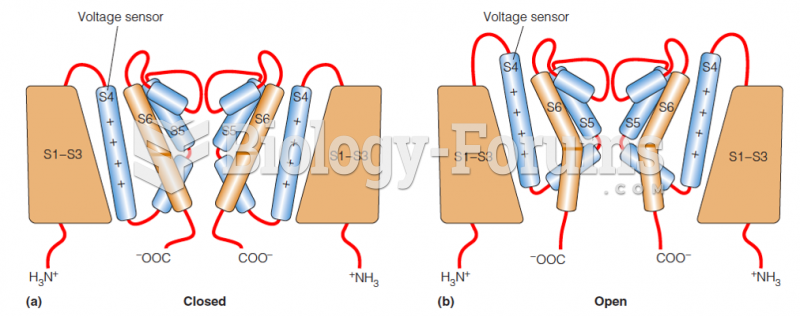 A model for voltage-gating in the channel
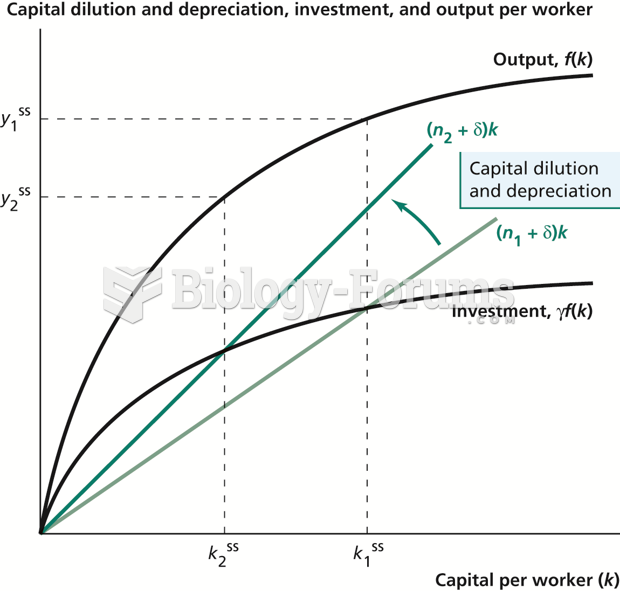 The Solow Model Incorporating Population Growth