This topic contains a solution. Click here to go to the answer
|
|
|

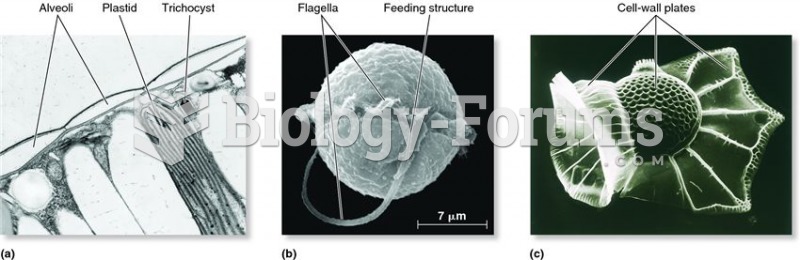 Dinoflagellates of the supergroup Alveolata and their characteristic alveoli.
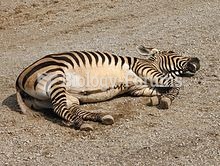 Hartmann's mountain zebra resting, showing its characteristic essentially unbarred belly
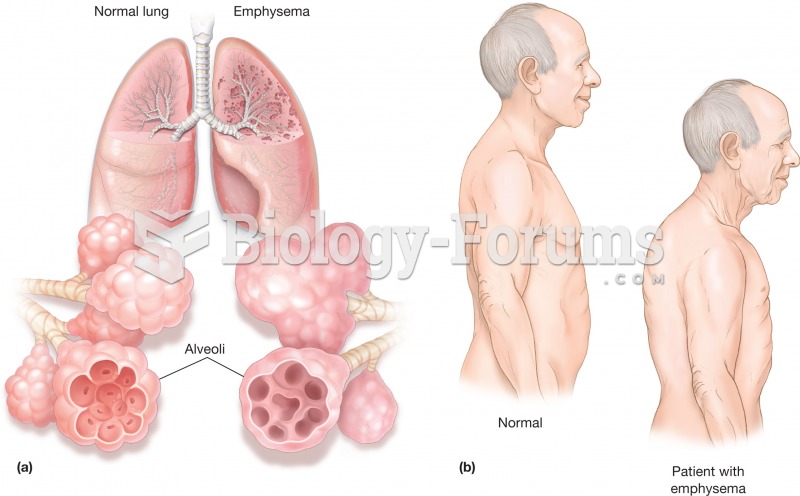 Emphysema. (a) Illustration comparing normal lungs and emphysemic lungs. The inserts illustrate how
 Jaguar F-type front
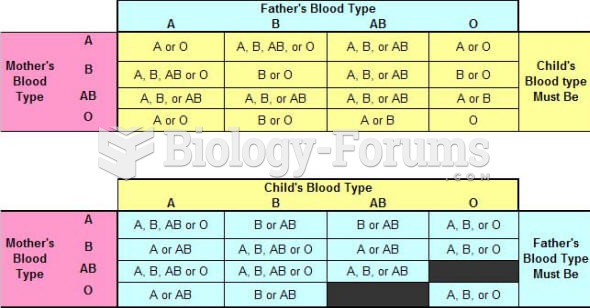 Paternity Determination by Blood Type
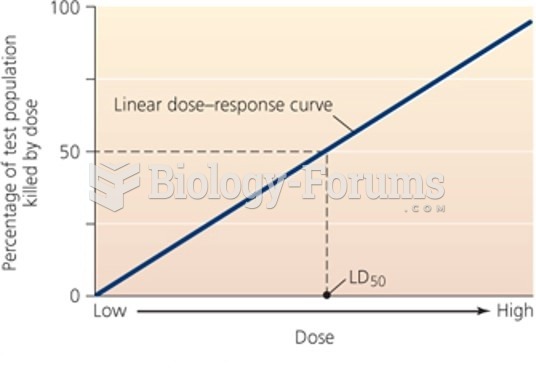 Linear dose-response curve