|
|
|

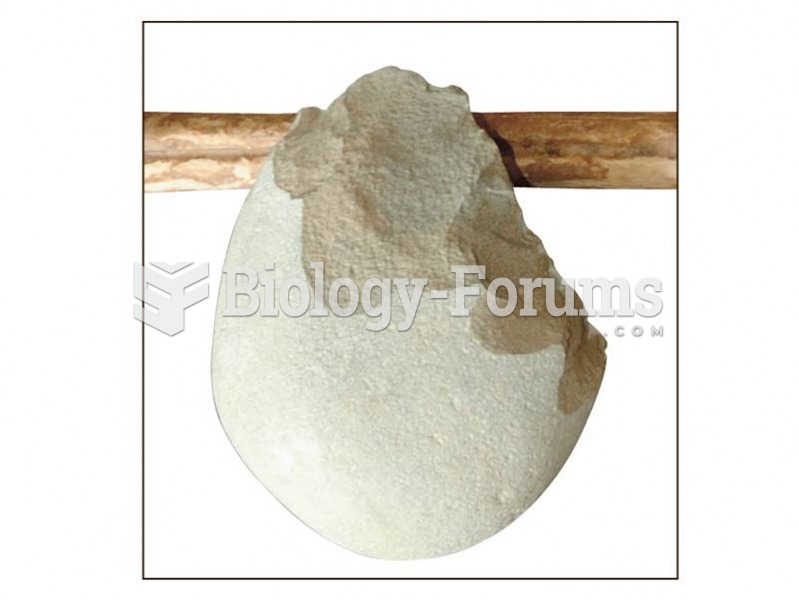 An experimentally made Oldowan type core.
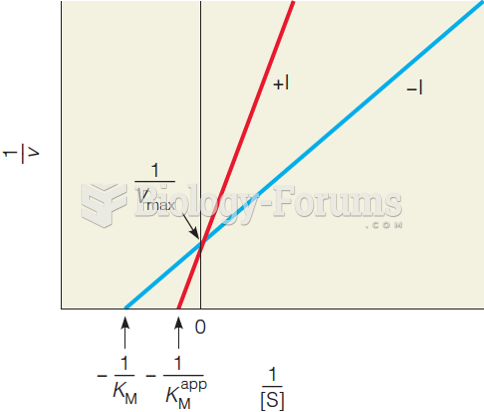 Lineweaver–Burk plots of the reactions with and without a competitive inhibitor
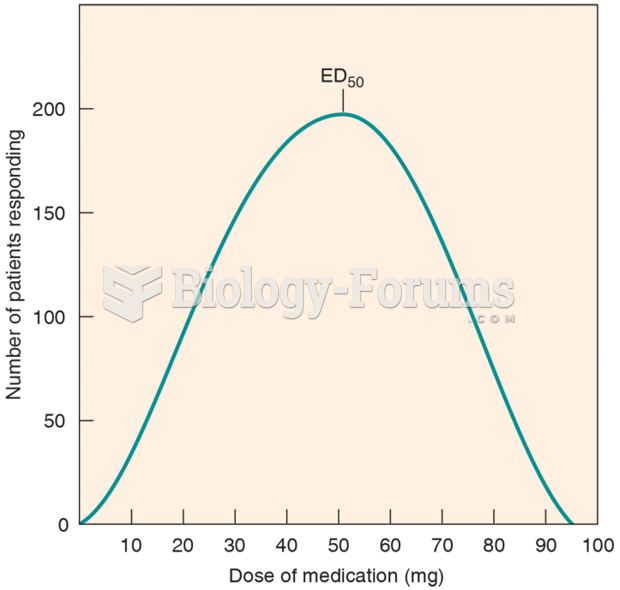 The Frequency Distribution Curve of a Drug
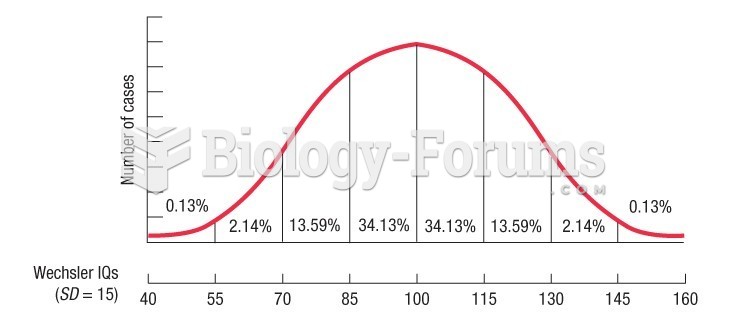 IQ scores form what mathematicians call a normal distribution "bell curve"
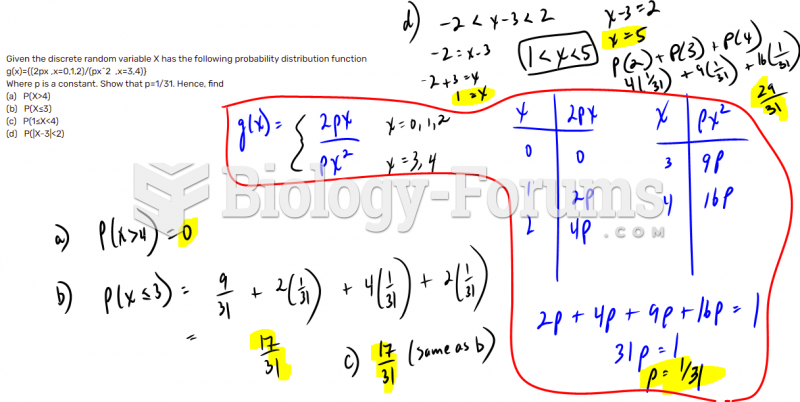 Discrete random variables- Probability Distribution Function
 Wild-type flowers of Arabidopsis