|
|
|

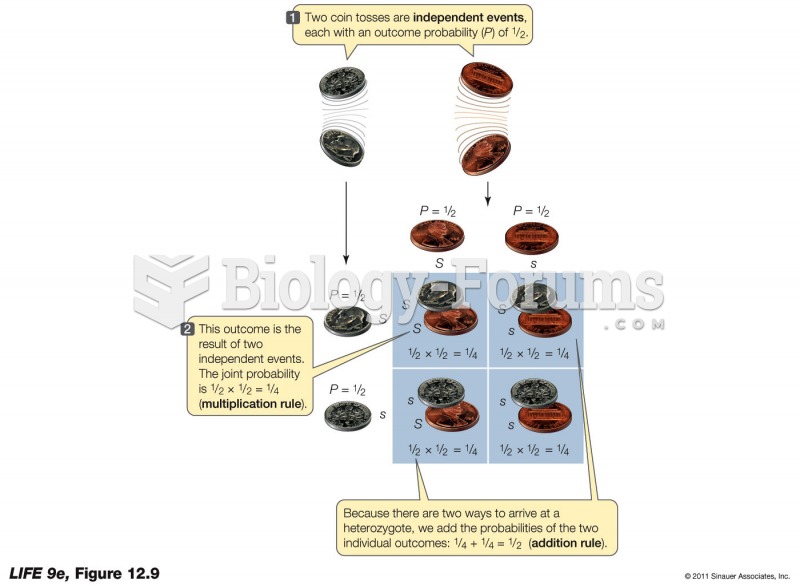 Using Probability Calculations in Genetics
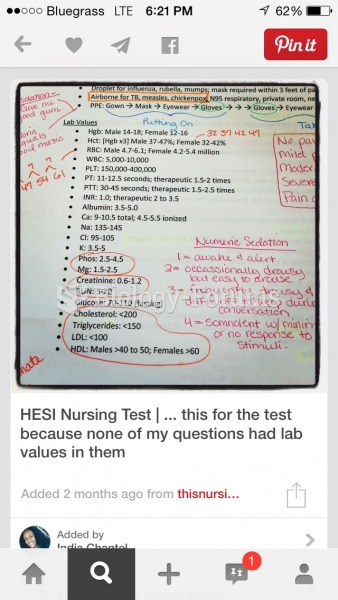 Normal lab values
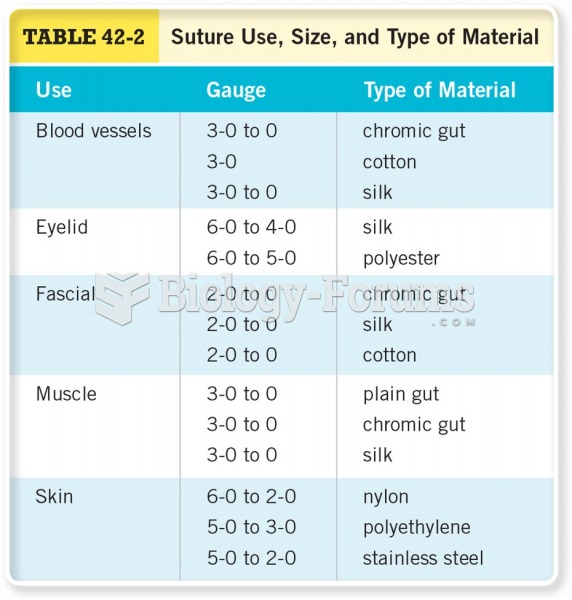 Suture Use, Size, and Type of Material
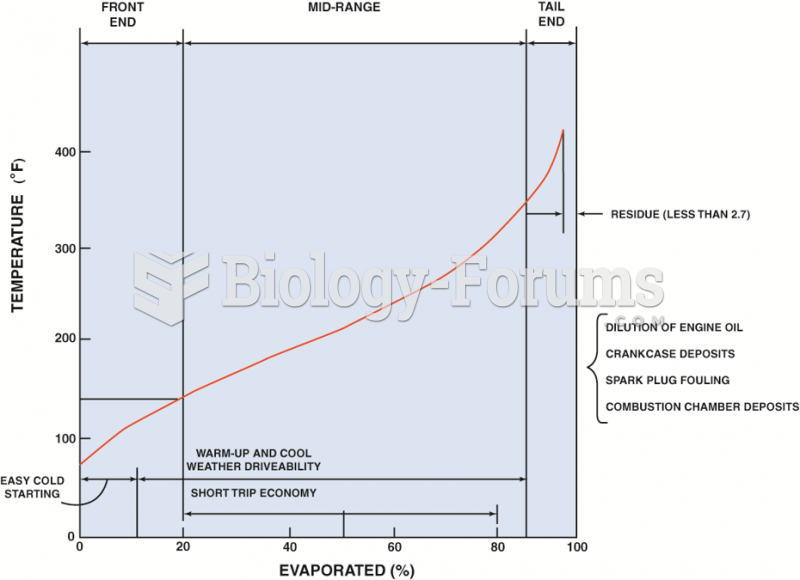 A typical distillation curve. Heavier molecules evaporate at higher temperatures and contain more ...
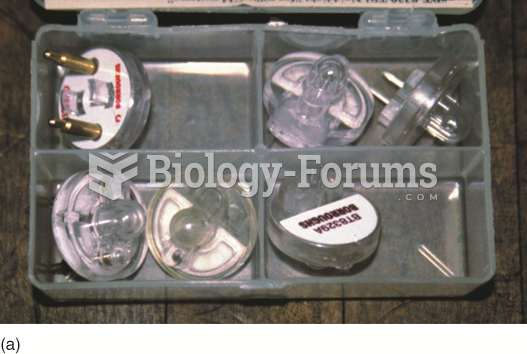 Noid lights are usually purchased as an assortment so that one is available for any type or size ...
 Calculation of Joint Probability of a Genotype Based on Seven CODIS STR Markers