This topic contains a solution. Click here to go to the answer
|
|
|

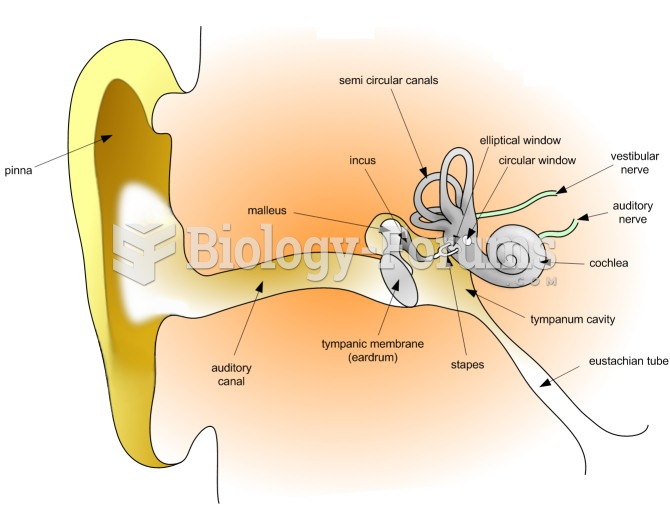 A simplified diagram of the Human Ear
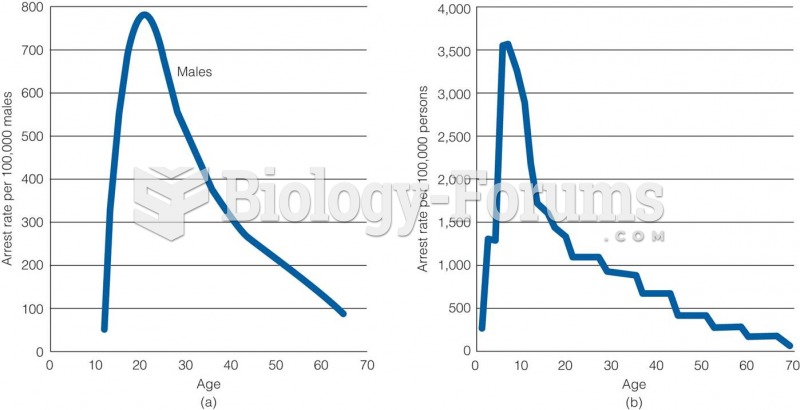 Age-Crime Relationship in (a) 1842 and (b) 1992
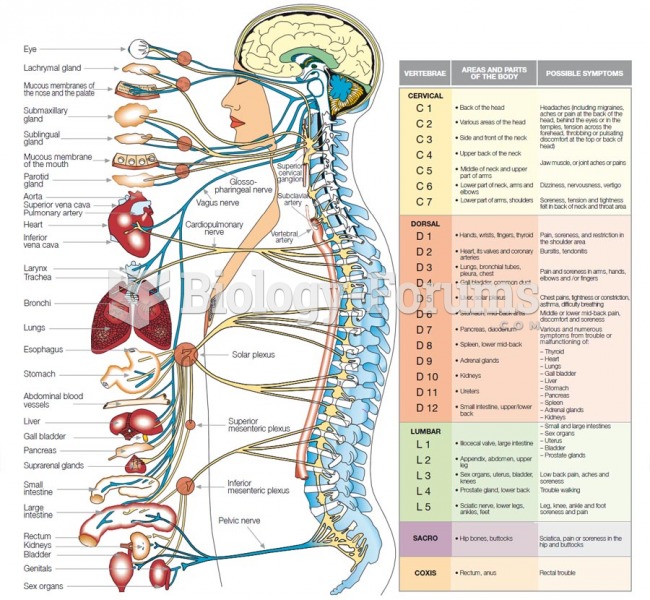 Anatomy diagram
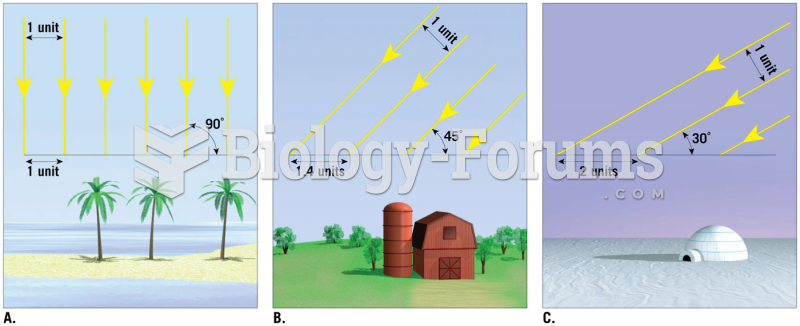 Relationship of Sun Angle and Solar Radiation
 Relationship between birth weight and mortality in humans
 The forked-line method for determining gamete genotype frequency