This topic contains a solution. Click here to go to the answer
|
|
|

 pH values of common solutions
 Organizational Effects of Testosterone Around the time of birth, testosterone masculinizes and defem
 How to find the equation of a line that is perpendicular to a line passing through a point
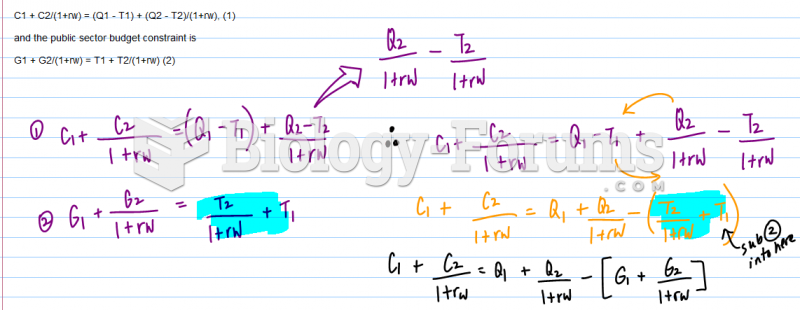 Consider a two-period economy with no investment opportunities: first and second period output ...
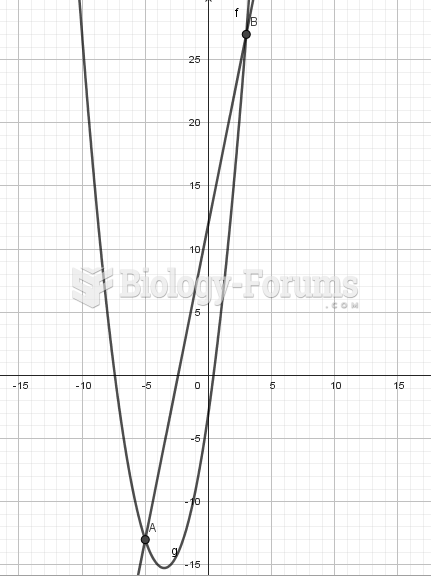 The line with the equation y=5x+12 intersects the parabola with equation y=xsqared+7x-3 at the ...