This topic contains a solution. Click here to go to the answer
|
|
|

 Relative permeability of an artificial phospholipid bilayer to a variety of solutes.
 Ugonachomma display figure, Igbo, Nigeria.
 Providing structure and organization in the child’s environment may aid the development of ...
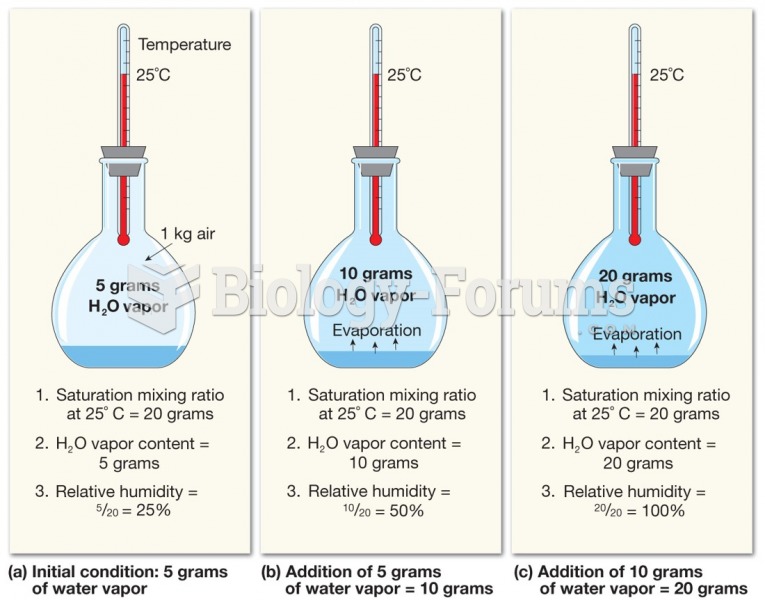 Relative Humidity
 How to graph line equations without a table of values
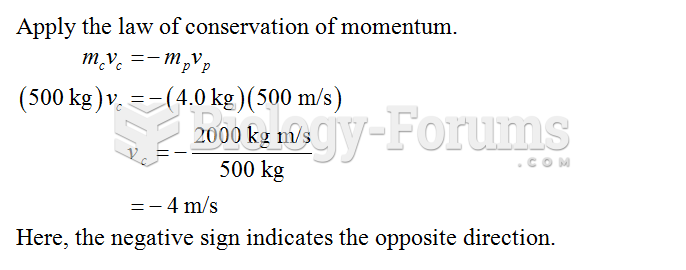 A 500-kg cannon fires a 4.0-kg projectile with a velocity of 500 m/s relative to