This topic contains a solution. Click here to go to the answer
|
|
|

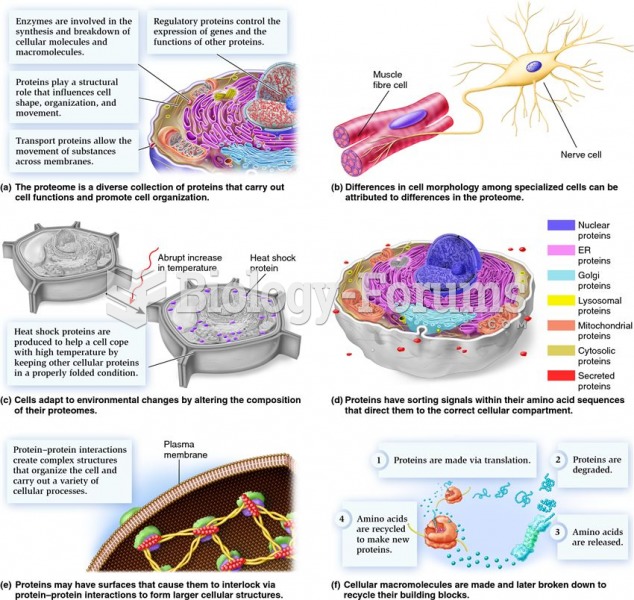 Proteomes and their relationship to cell structure, function, and organization.
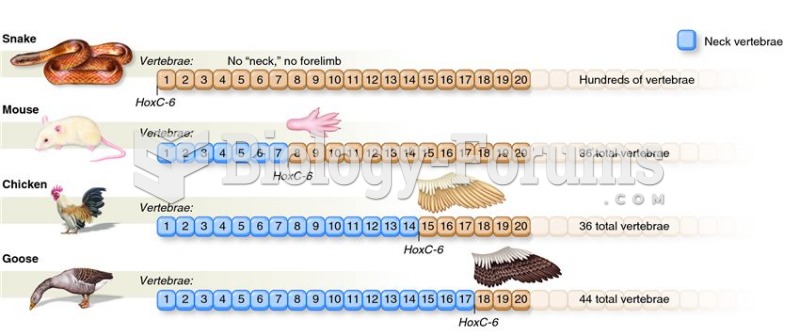 Relationship between HoxC-6 gene expression and neck development.
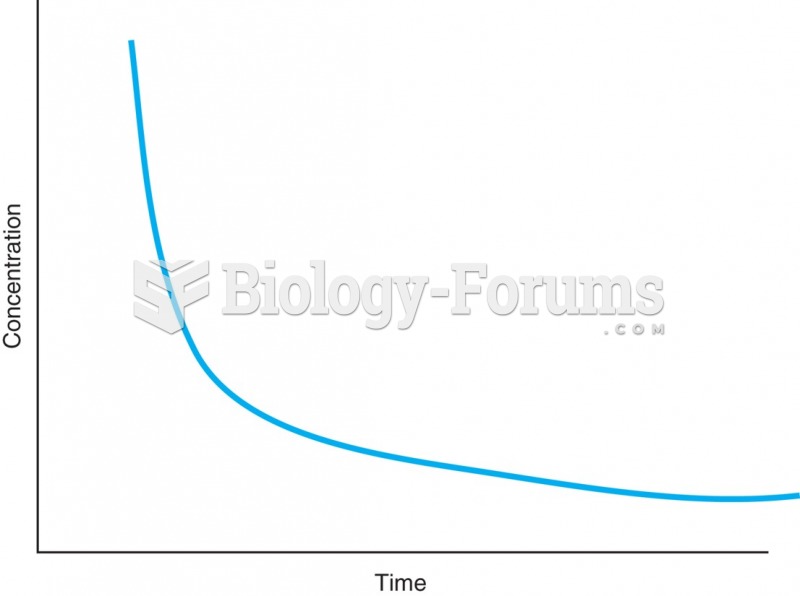 Most drugs exhibit first-order elimination, in which the rate of drug elimination is equivalent to ...
 In order to encourage Canadians to avoid cross border shopping, Walmart Canada is striving to ...
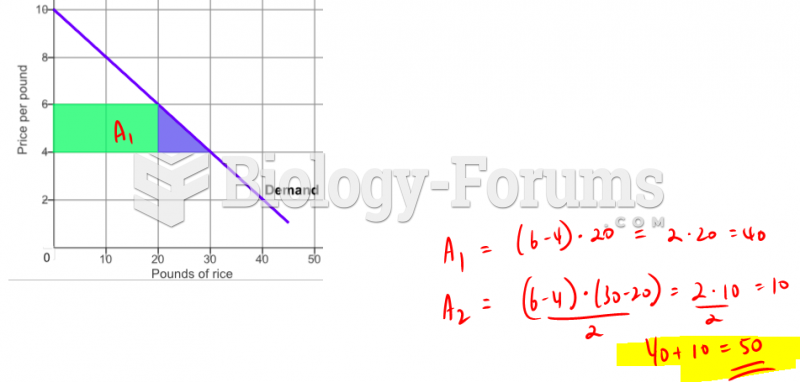 The price of rice in a small country is currently $6 per pound. In order to help low-income ...
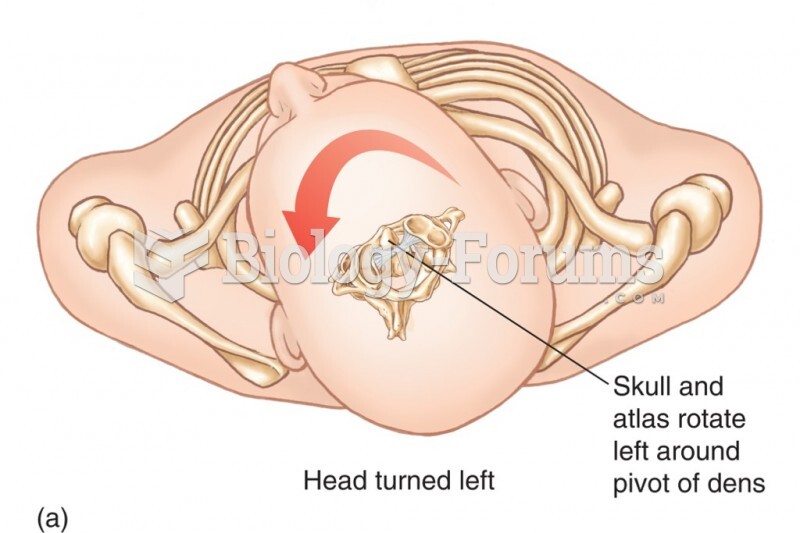 Relationship Between the Atlas and the Axis. The Dens of the Axis Provides a Pivotal Point Around Wh