|
|
|

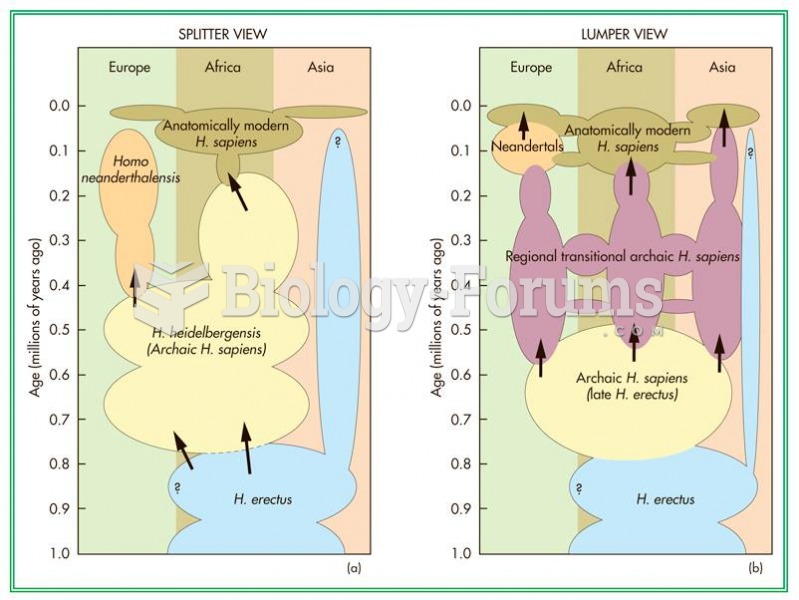 Two views of the phylogenetic relationship between Neandertals and modern H. sapiens.
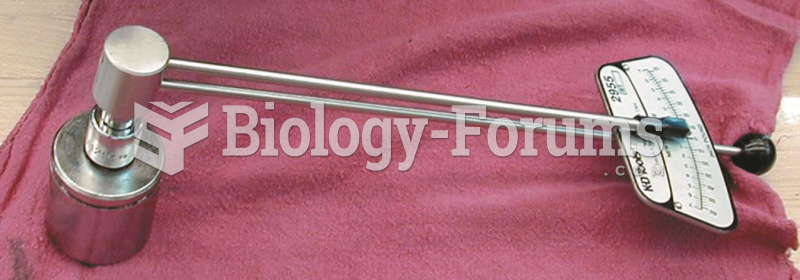 A beam-type torque wrench that displays the torque reading on the face of the dial. The beam display ...
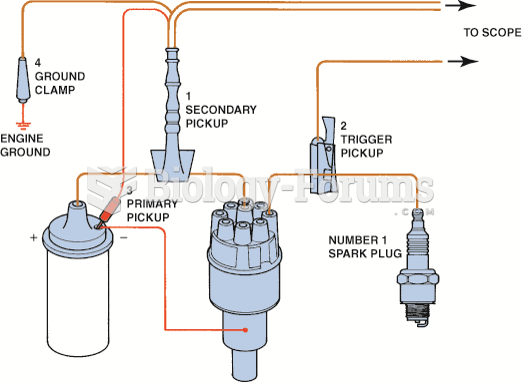 Typical engine analyzer hookup that includes a scope display. (1) Coil wire on top of the ...
 How to manually solve a linear system with three variables without matrices (Question 1 of 2)
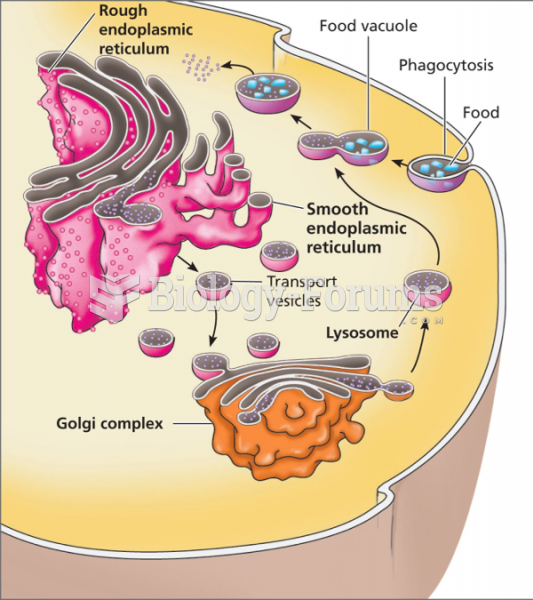 The relationship between the Golgi complex and lysosomes
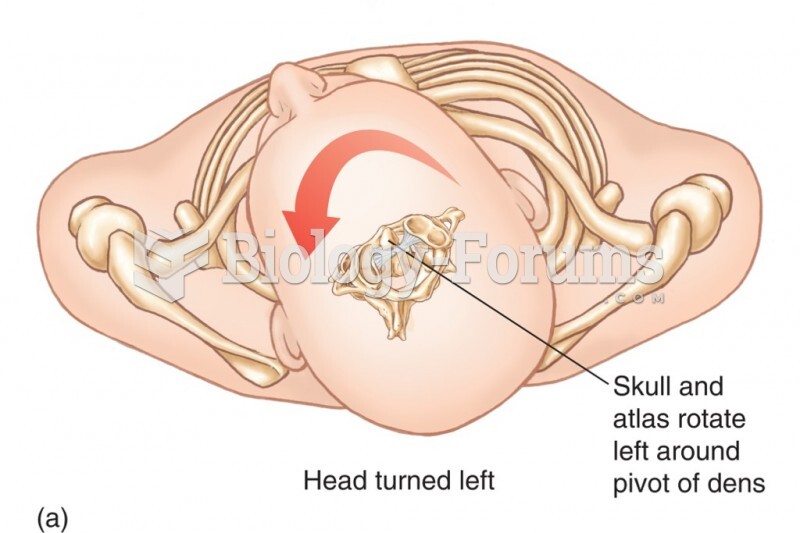 Relationship Between the Atlas and the Axis. The Dens of the Axis Provides a Pivotal Point Around Wh