This topic contains a solution. Click here to go to the answer
|
|
|

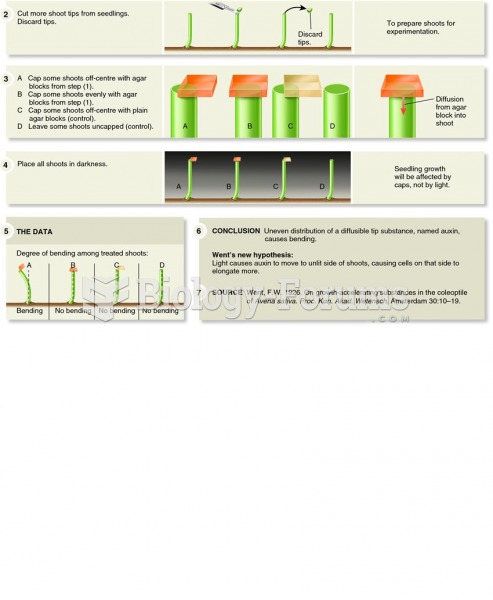 Went and Briggs demonstrated the relationship between light perception and auxin function.
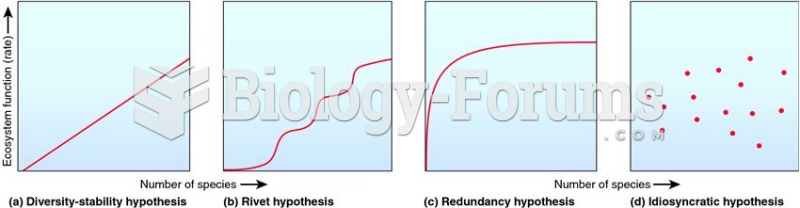 Four main models that describe the relationship between ecosystem function and biodiversity.
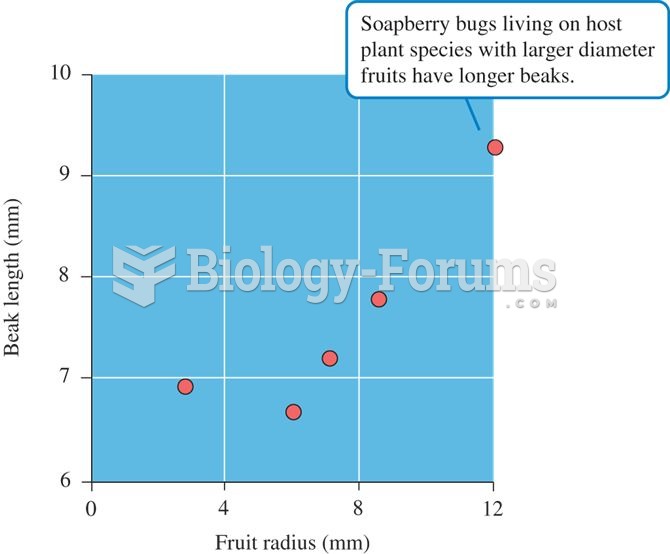 Relationship between fruit radius and beak length in populations of native and introduced species of
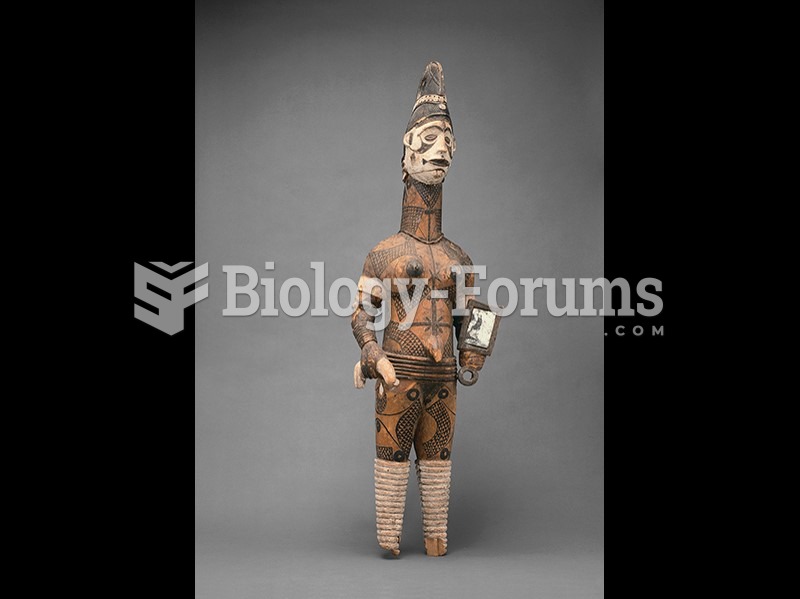 Ugonachomma display figure, Igbo, Nigeria.
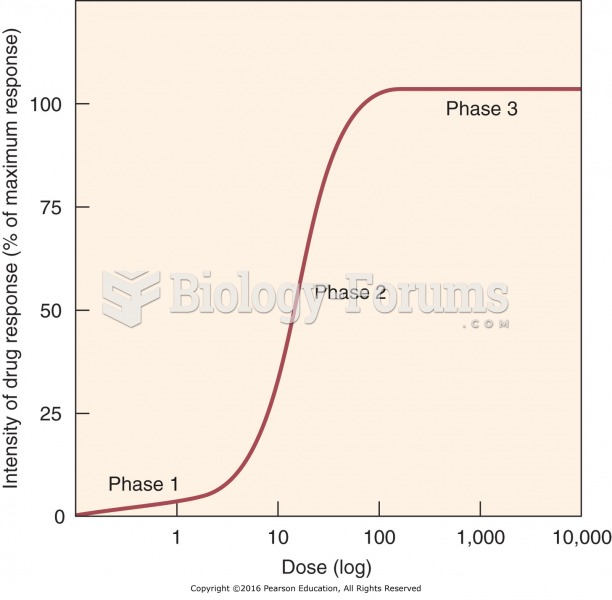 Dose–response relationship.
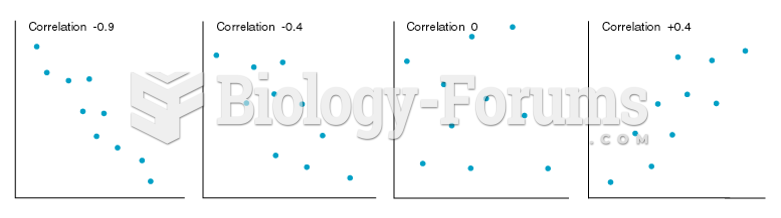 Scatterplots of Variables Having Several Different Levels of Correlation