This topic contains a solution. Click here to go to the answer
|
|
|

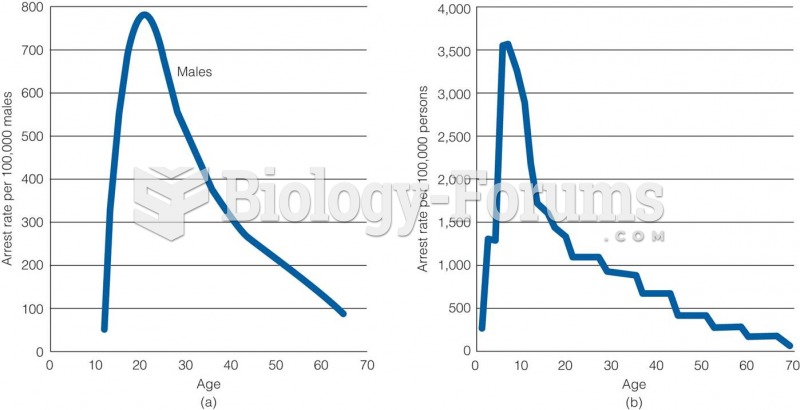 Age-Crime Relationship in (a) 1842 and (b) 1992
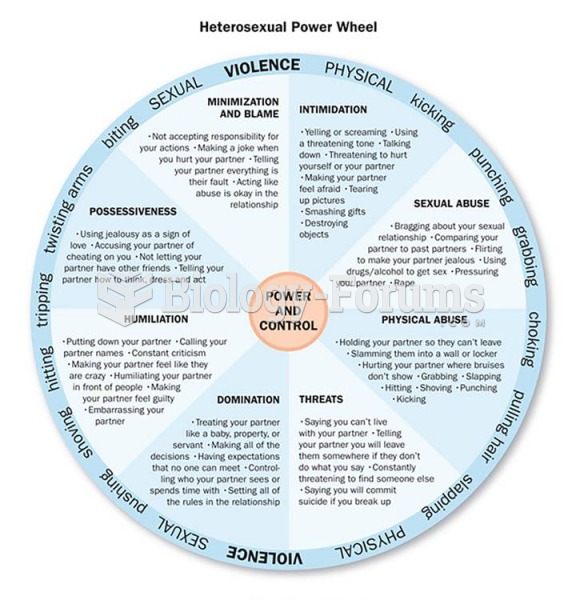 The Power and Control Wheels of Abusive Relationships When one person in a relationship repeatedly ...
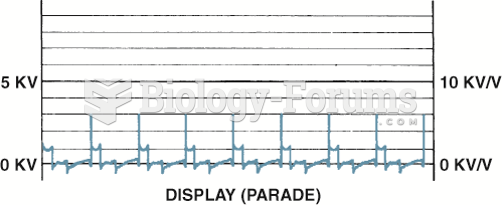 Display is the only position to view the firing lines of all cylinders. Cylinder 1 is displayed on ...
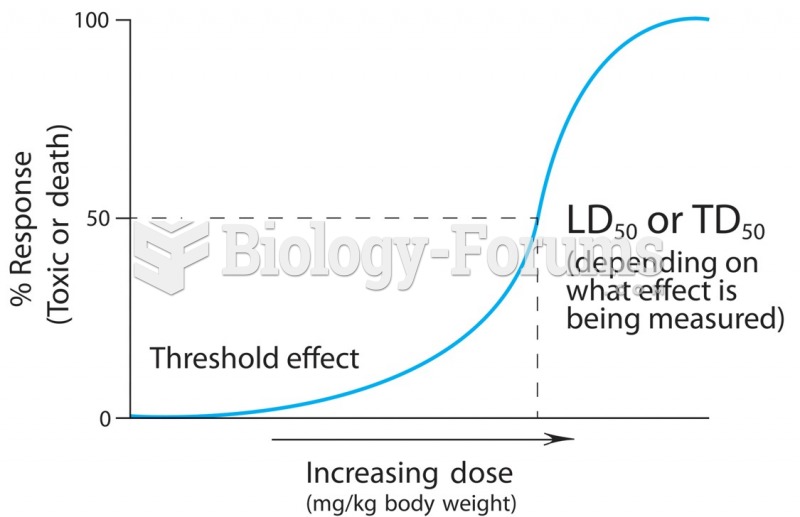 A dose-response curve describes the relationship between the quantity of the chemical entering the ...
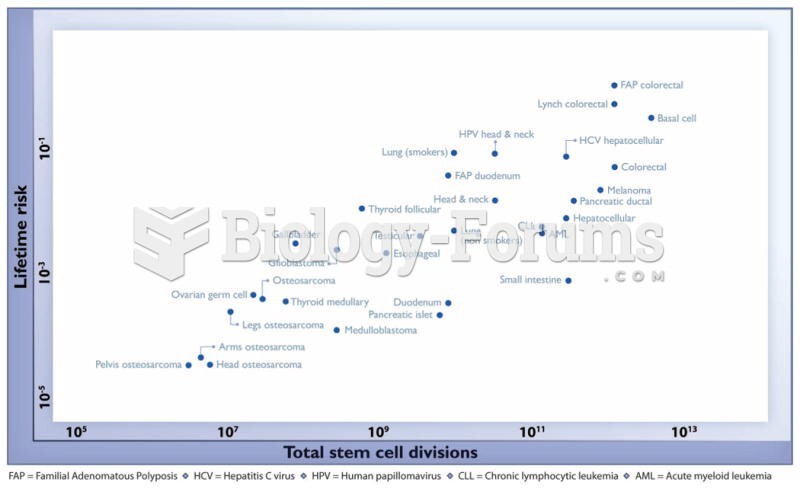 The relationship between the number of stem cell divisions in the lifetime of a given tissue and the
 The relationship between acid–base imbalances and potassium imbalances