This topic contains a solution. Click here to go to the answer
|
|
|

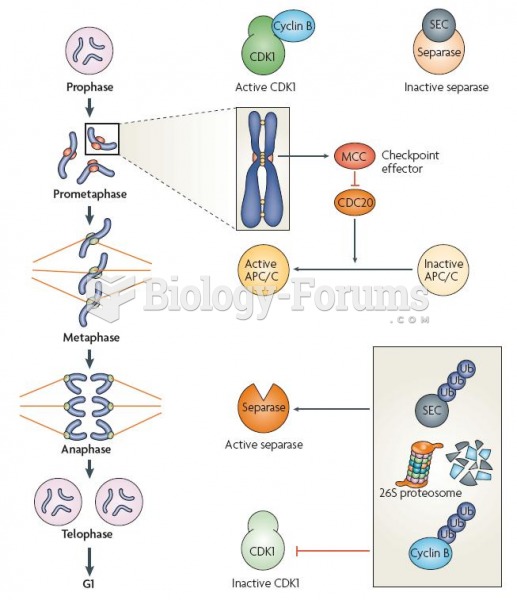 Relationship of the spindle-assembly checkpoint (SAC) with the cell-cycle machinery
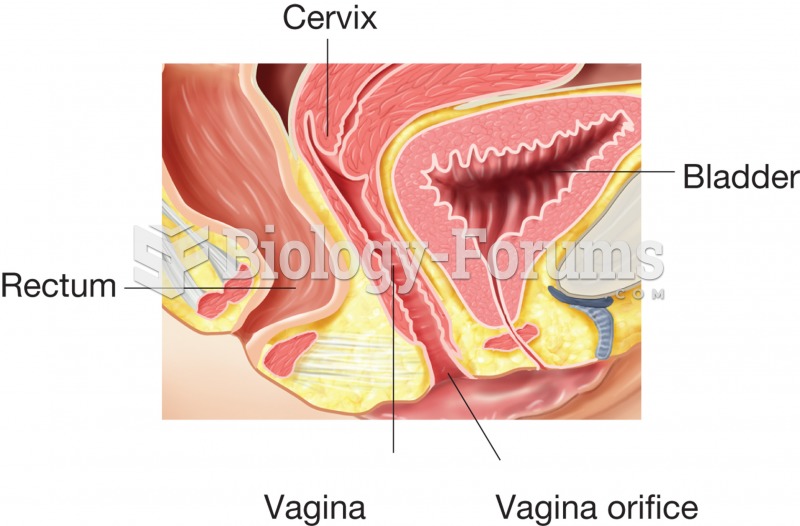 The vagina, sagittal section showing the location of the vagina and its relationship to the cervix,
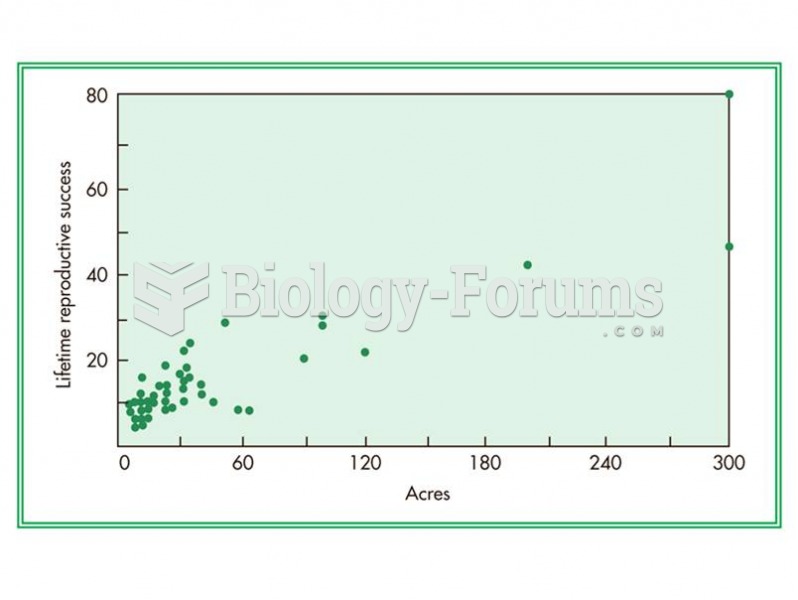 The relationship between number of acres a Kipsigis man owns and the number of offspring he has duri
 How to plot a sine function containing an amplitude and phase-shift (Question 2 of 3)
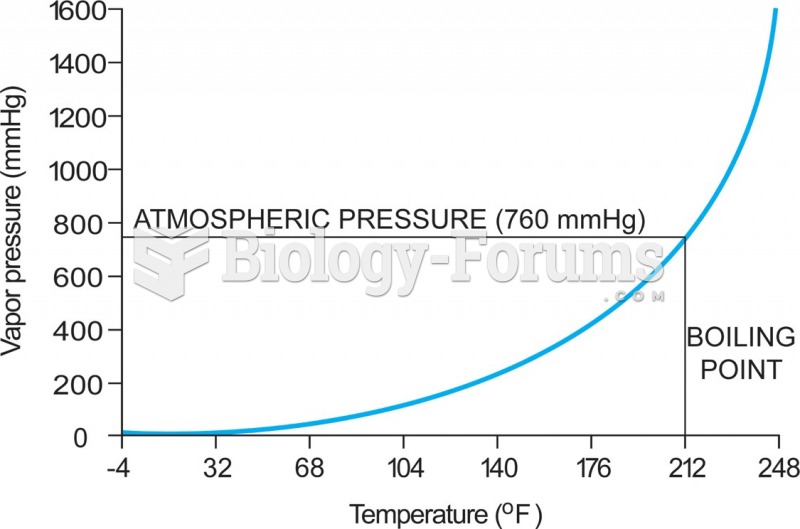 5-4 The relationship between vapor pressure and temperature—in this case for water. As the ...
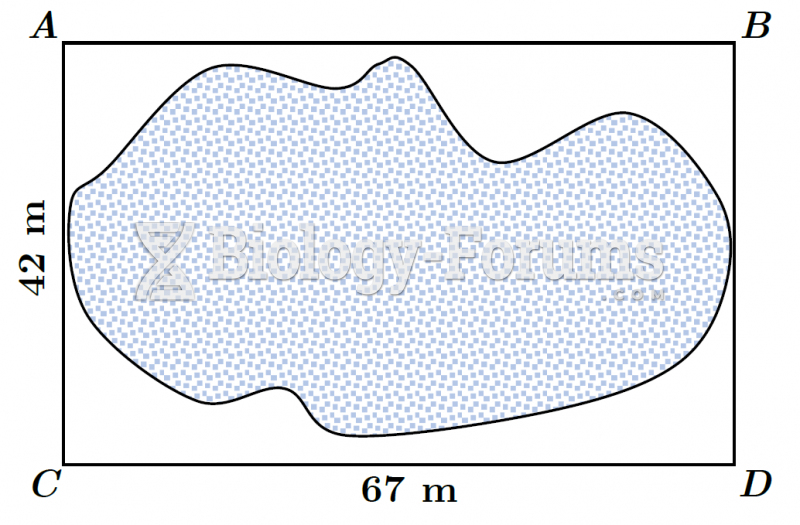 Plot of Land (Modified Offset Method) - Boxed