|
|
|

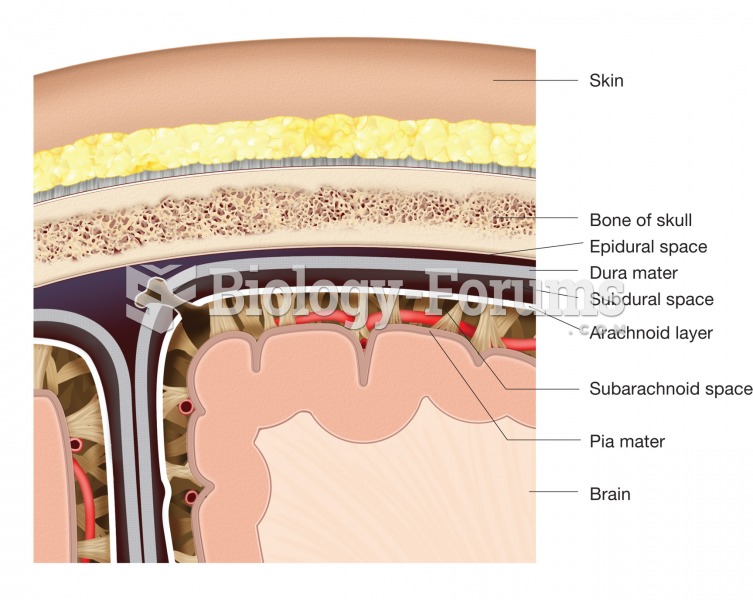 The meninges. This figure illustrates the location and structure of each layer of the meninges and t
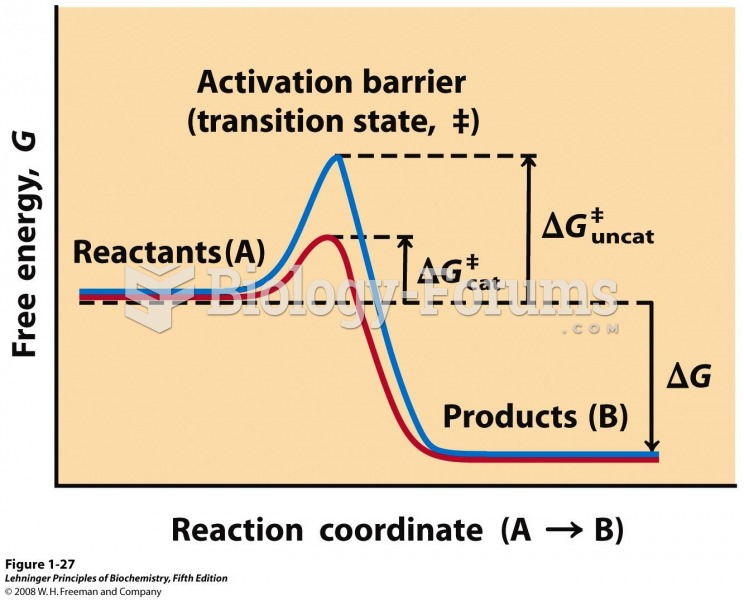 An activation barrier, representing the transition state
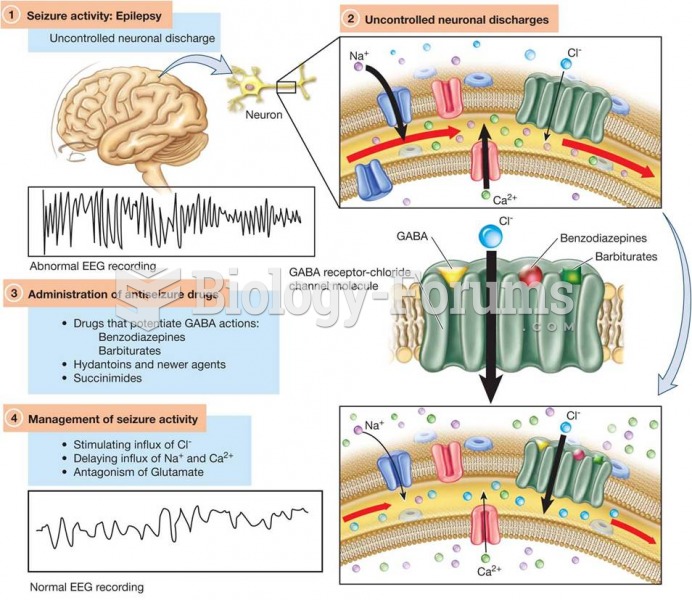 Model of the GABA Receptor–Chloride Channel Molecules in Relationship to Antiseizure Pharmacotherapy
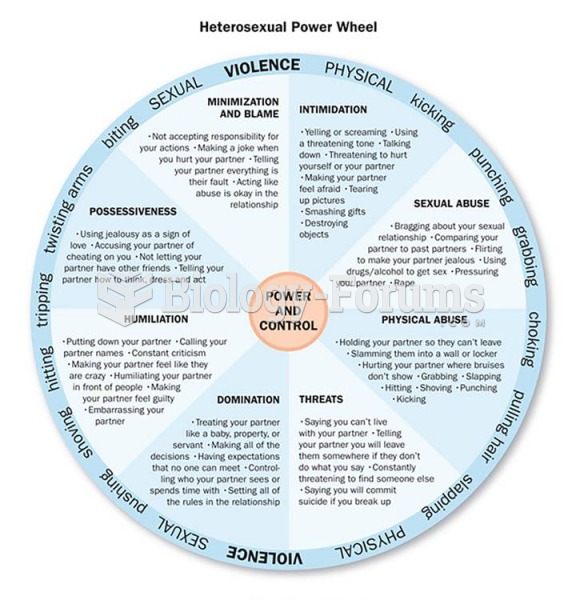 The Power and Control Wheels of Abusive Relationships When one person in a relationship repeatedly ...
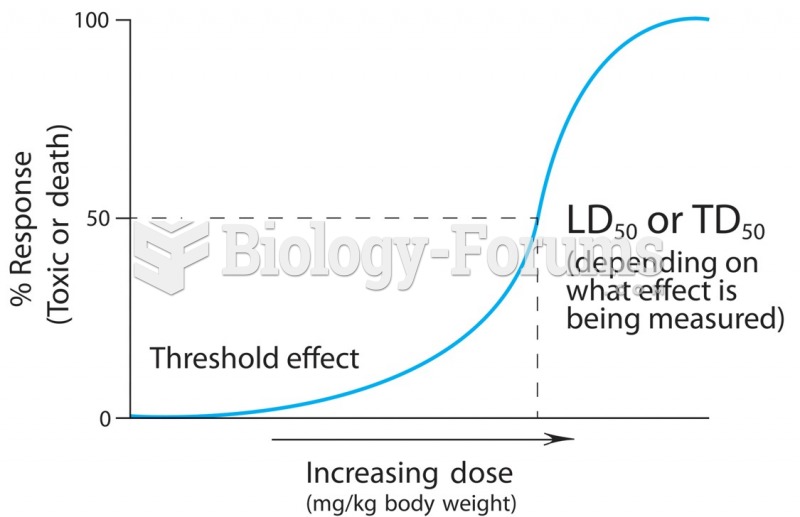 A dose-response curve describes the relationship between the quantity of the chemical entering the ...
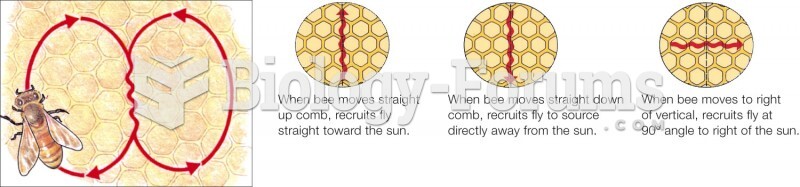 Tactile Display: Honeybee Dances