|
|
|

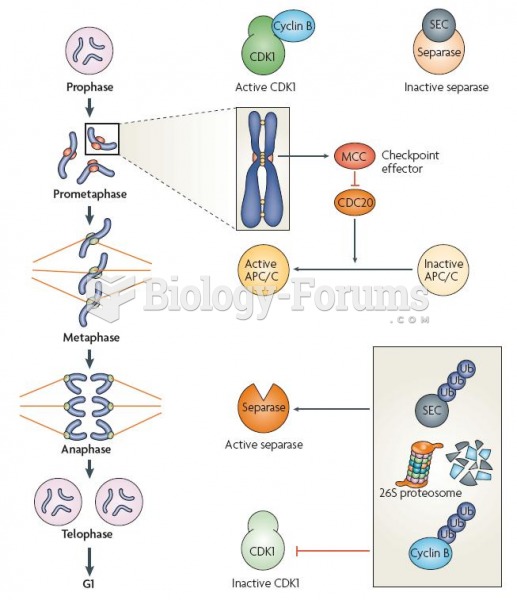 Relationship of the spindle-assembly checkpoint (SAC) with the cell-cycle machinery
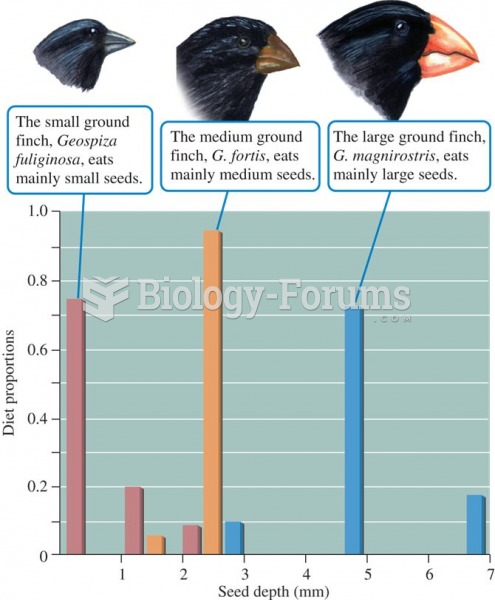 Relationship between body size and seed size in Galapagos finch species
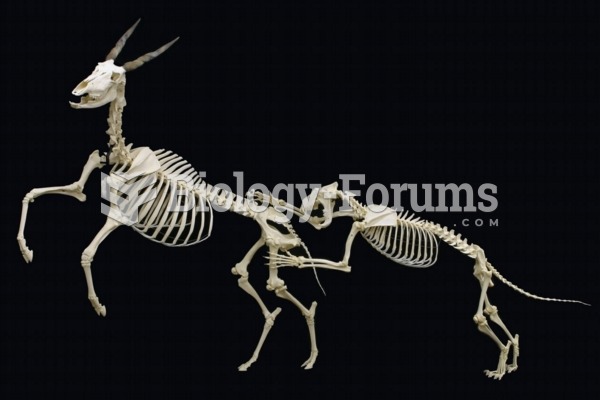 A skeletal mount of an African Lion attacking a Common Eland on display at The Museum of Osteology,
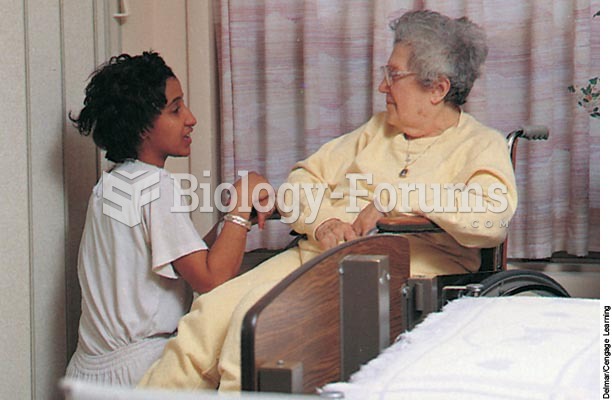 Establishing a caring and trusting relationship helps the client come to terms with a terminal illne
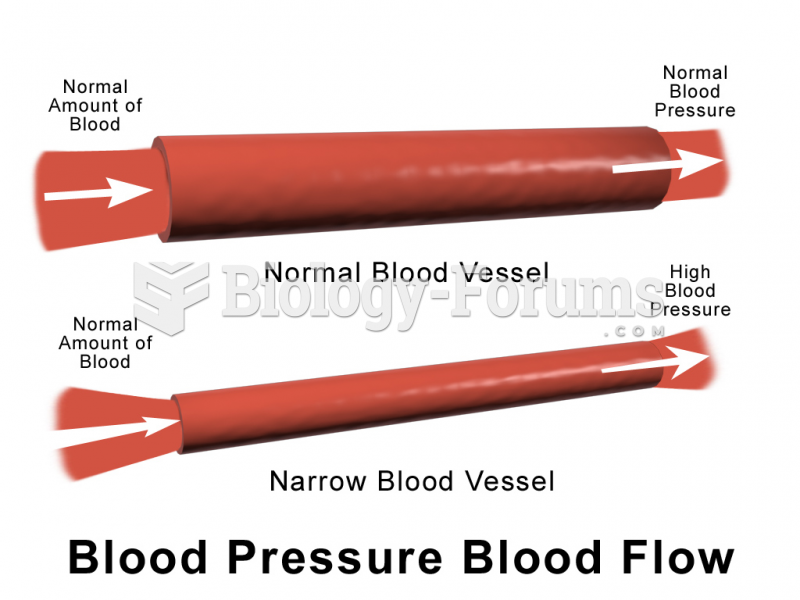 Blood pressure and blood volume relationship
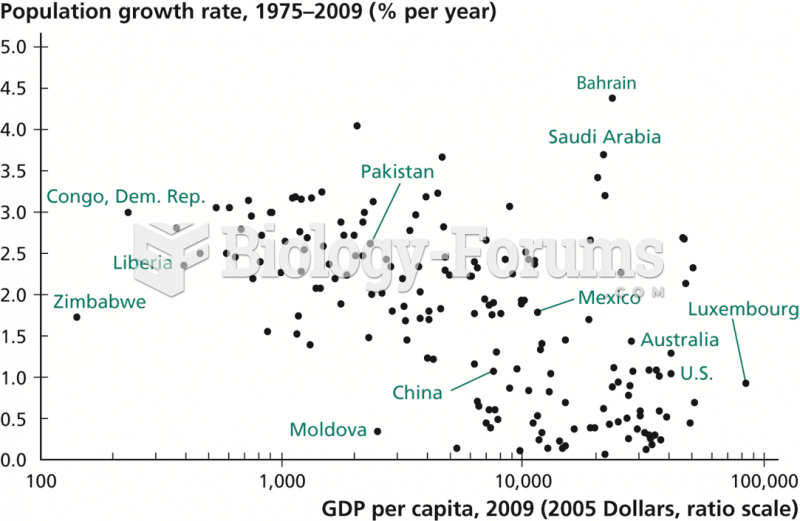 Relationship between Income per Capita and Population Growth