|
|
|

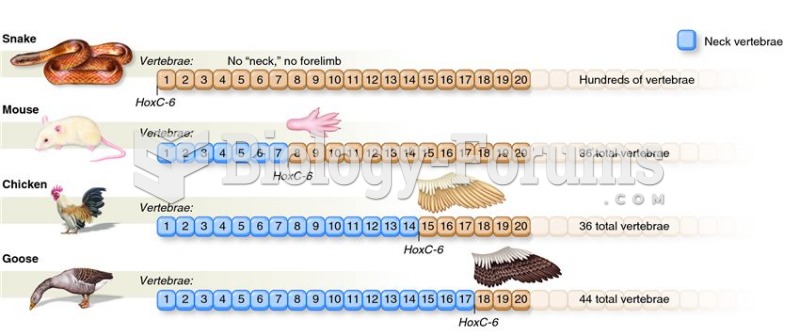 Relationship between HoxC-6 gene expression and neck development.
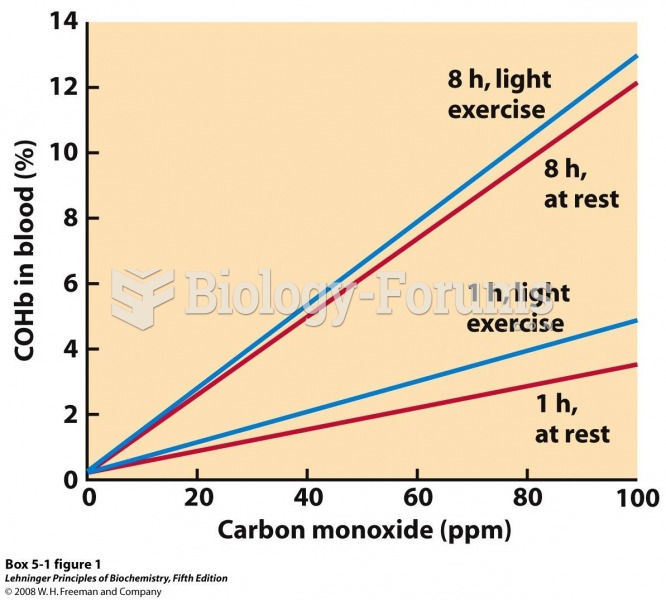 Relationship between levels of COHb in blood and concentration of CO in the surrounding air
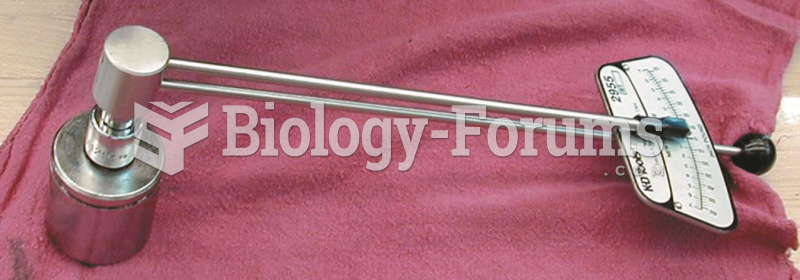 A beam-type torque wrench that displays the torque reading on the face of the dial. The beam display ...
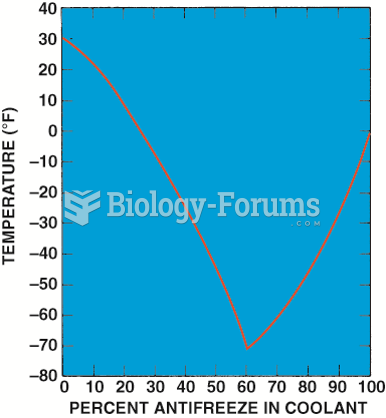 Graph showing the relationship between the freezing point of the coolant and the percentage of ...
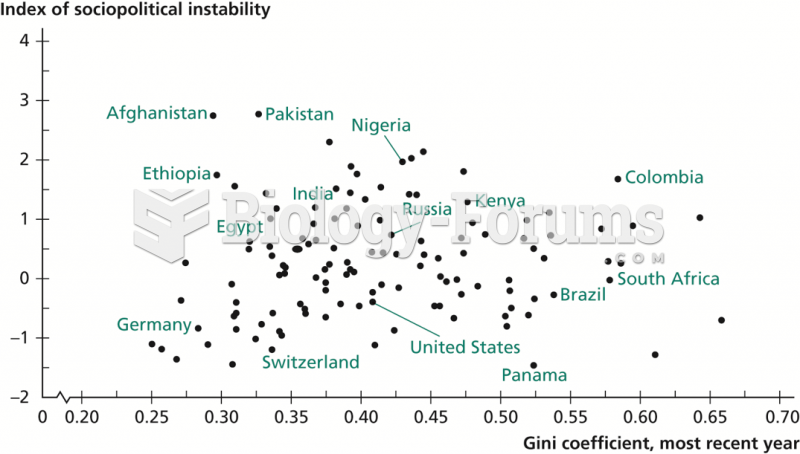 Relationship between Income Inequality and Sociopolitical Instability
 The relationship between recombination frequency and physical distance between genes