This topic contains a solution. Click here to go to the answer
|
|
|

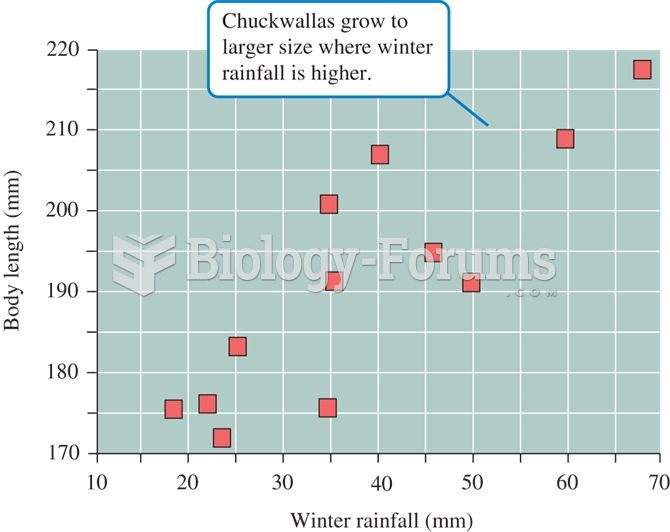 Relationship between winter rainfall and chuckwalla, Sauromalus, size
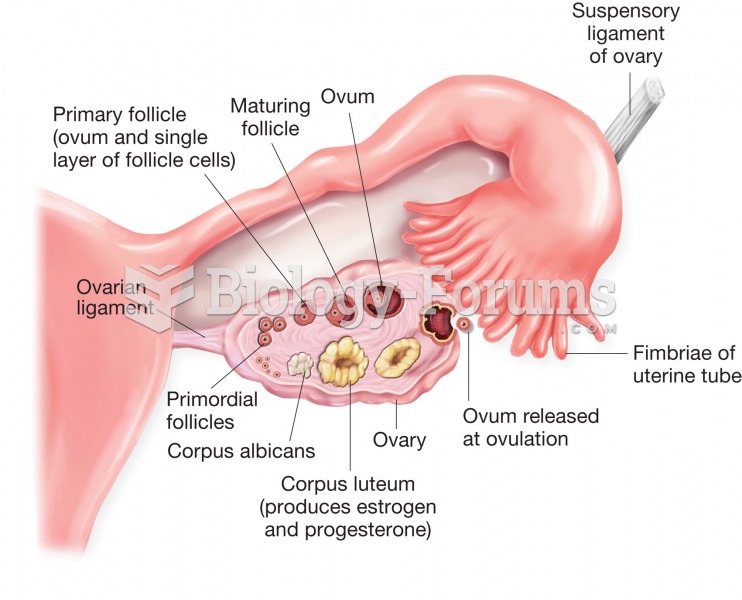 Structure of the ovary and uterine (fallopian) tube. Figure illustrates stages of ovum development a
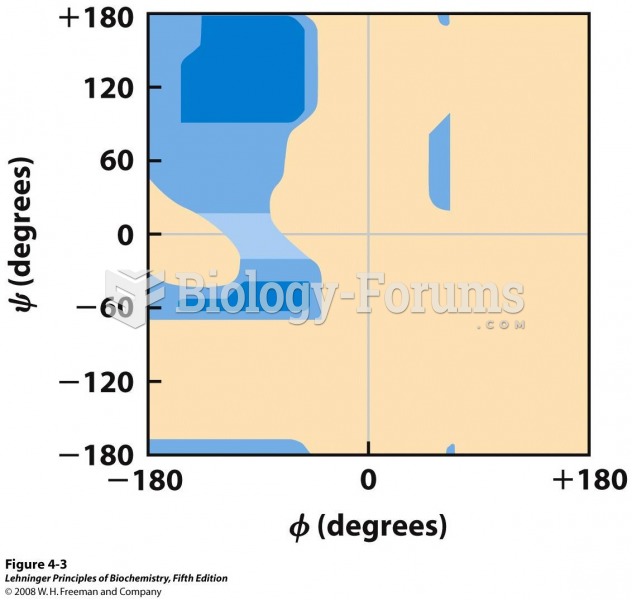 Ramachandran plot for L-Ala residues
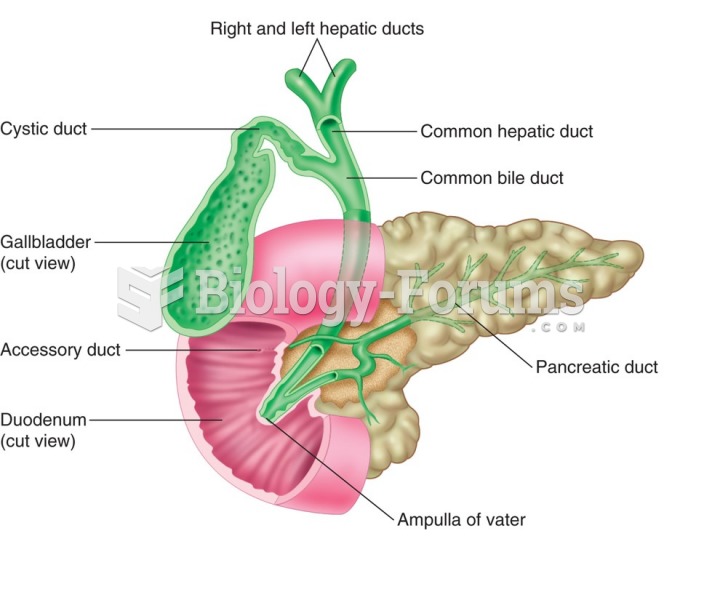 Relationship between the pancreas and the digestive system.
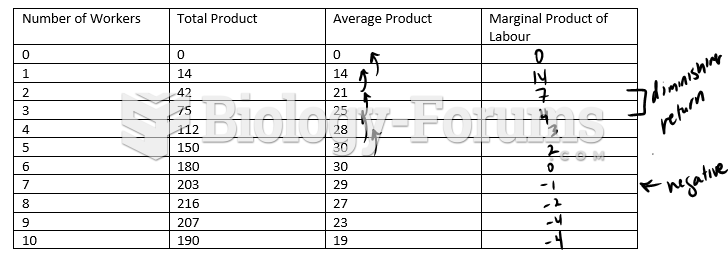 Complete the following production chart and plot the points.
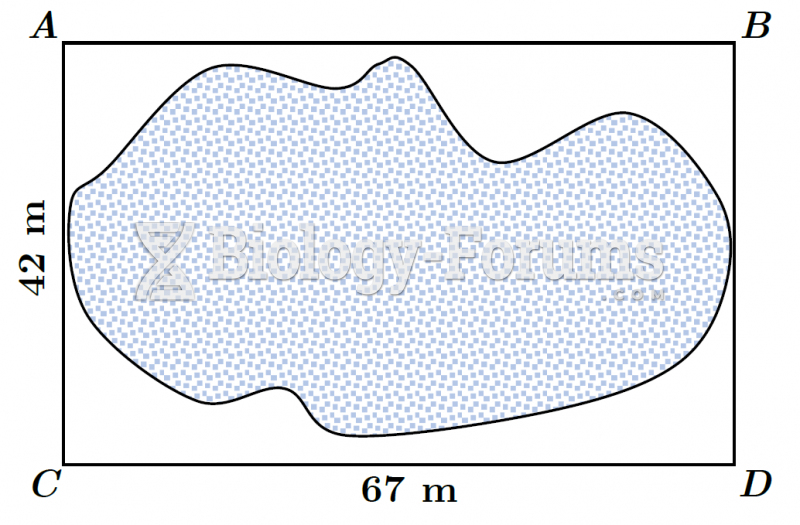 Plot of Land (Modified Offset Method) - Boxed