This topic contains a solution. Click here to go to the answer
|
|
|

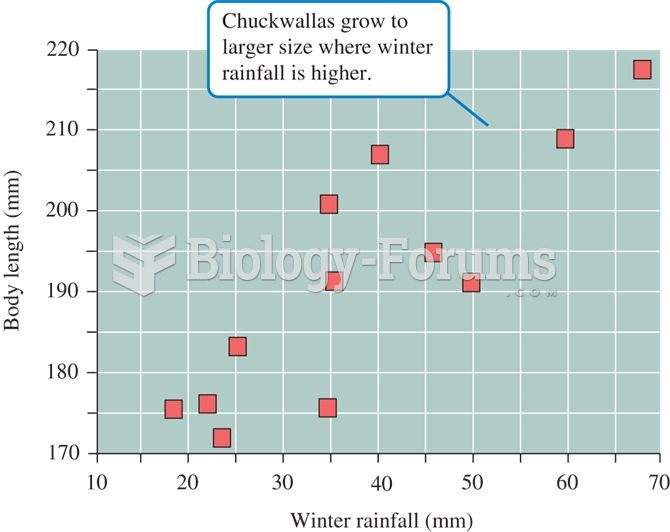 Relationship between winter rainfall and chuckwalla, Sauromalus, size
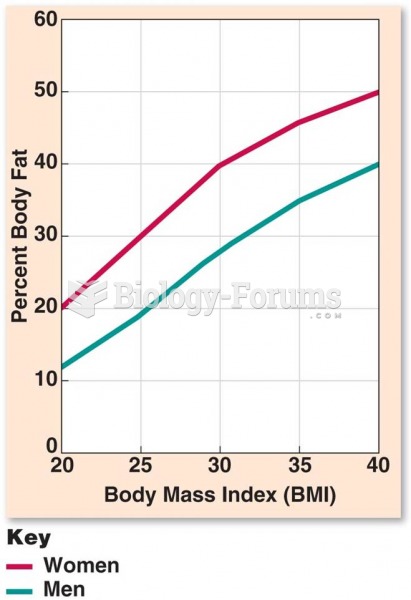 Relationship Between BMI and % BF
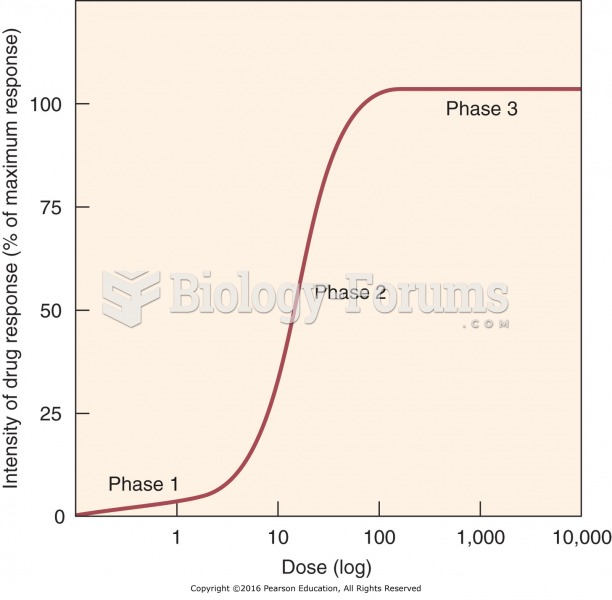 Dose–response relationship.
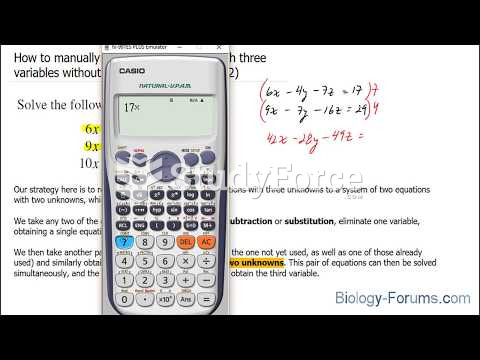 How to manually solve a linear system with three variables without matrices (Question 1 of 2)
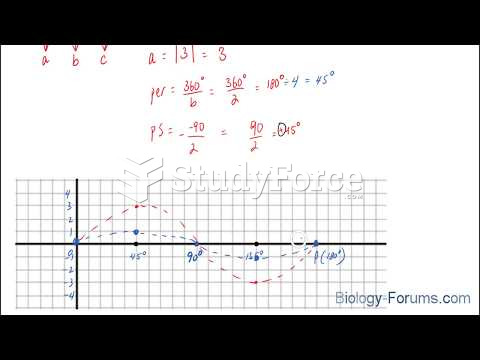 How to plot a sine function containing an amplitude and phase shift (Question 1 of 3)
 Plot of land (Part a)