This topic contains a solution. Click here to go to the answer
|
|
|

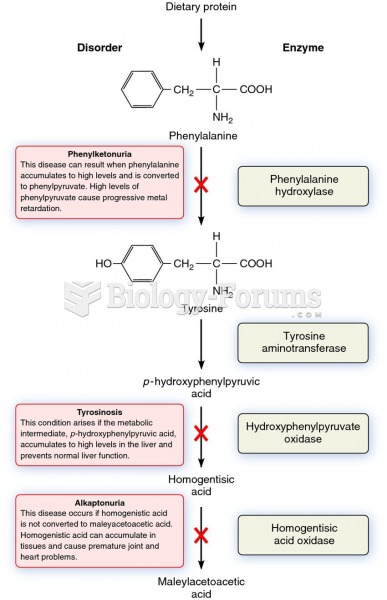 The metabolic pathway that breaks down phenylalanine and its relationship to certain genetic disease
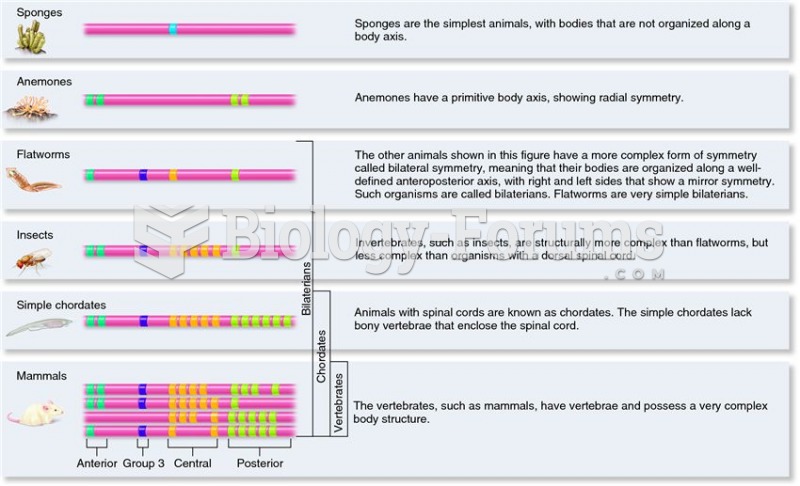 Relationship between Hox gene number and body complexity in different types of animals.
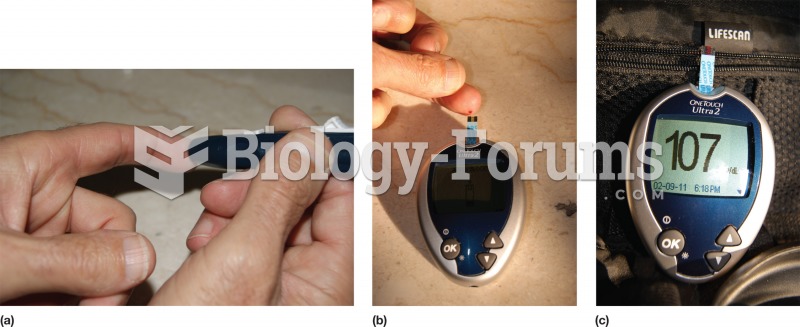 Blood glucose measurement. A postprandial test may be self-administered. (a) A lance pierces the ski
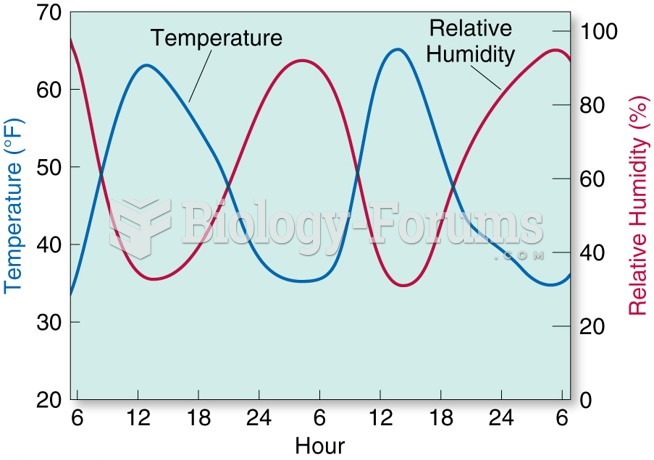 The relationship between RH and temperature.
 How to plot a sine function containing an amplitude and phase shift (Question 1 of 3)
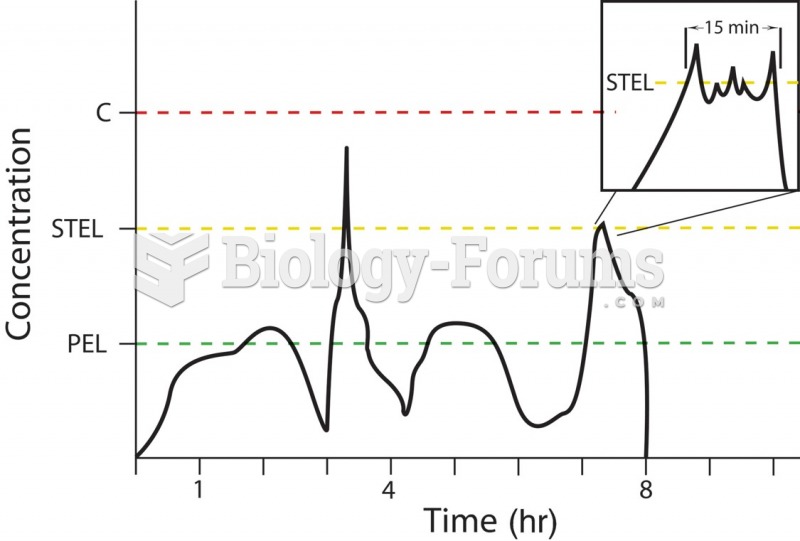 The relationship between the permissible exposure limit (PEL), the short-term exposure limit (STEL), ...