Did you know?
Since 1988, the CDC has reported a 99% reduction in bacterial meningitis caused by Haemophilus influenzae, due to the introduction of the vaccine against it.
Did you know?
Asthma-like symptoms were first recorded about 3,500 years ago in Egypt. The first manuscript specifically written about asthma was in the year 1190, describing a condition characterized by sudden breathlessness. The treatments listed in this manuscript include chicken soup, herbs, and sexual abstinence.
Did you know?
Historic treatments for rheumatoid arthritis have included gold salts, acupuncture, a diet consisting of apples or rhubarb, nutmeg, nettles, bee venom, bracelets made of copper, prayer, rest, tooth extractions, fasting, honey, vitamins, insulin, snow collected on Christmas, magnets, and electric convulsion therapy.
Did you know?
Tobacco depletes the body of vitamins A, C, and E, which can result in any of the following: dry hair, dry skin, dry eyes, poor growth, night blindness, abscesses, insomnia, fatigue, reproductive system problems, sinusitis, pneumonia, frequent respiratory problems, skin disorders, weight loss, rickets, osteomalacia, nervousness, muscle spasms, leg cramps, extremity numbness, bone malformations, decayed teeth, difficulty in walking, irritability, restlessness, profuse sweating, increased uric acid (gout), joint damage, damaged red blood cells, destruction of nerves, infertility, miscarriage, and many types of cancer.

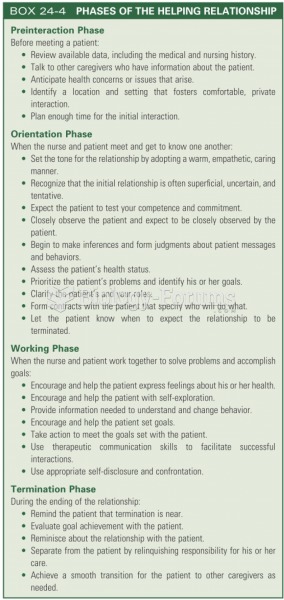 Phases of the working relationship
 This map shows the percentage of Protestants by state in Germany. When compared to the previous map
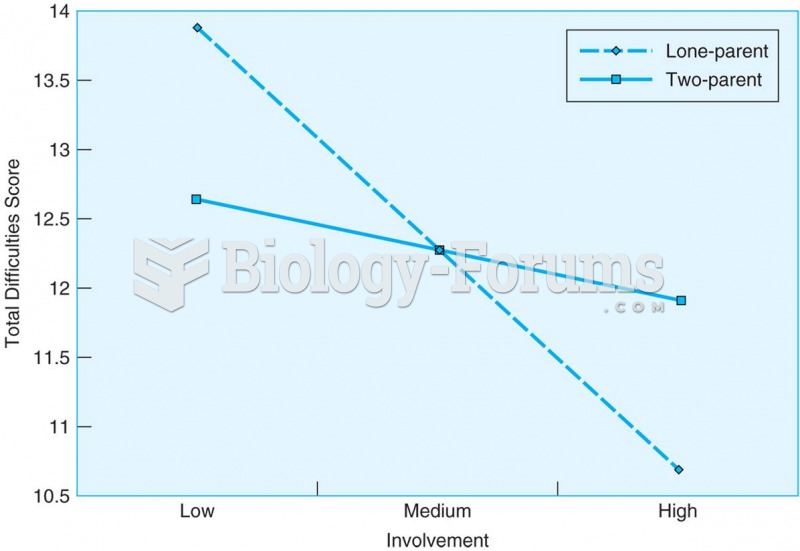 When teenagers live in single-parent homes, a good relationship with grandparents is related to ...
 The Circle of Relationship Issues and Sexual Problems
 Typical engine analyzer hookup that includes a scope display. (1) Coil wire on top of the ...
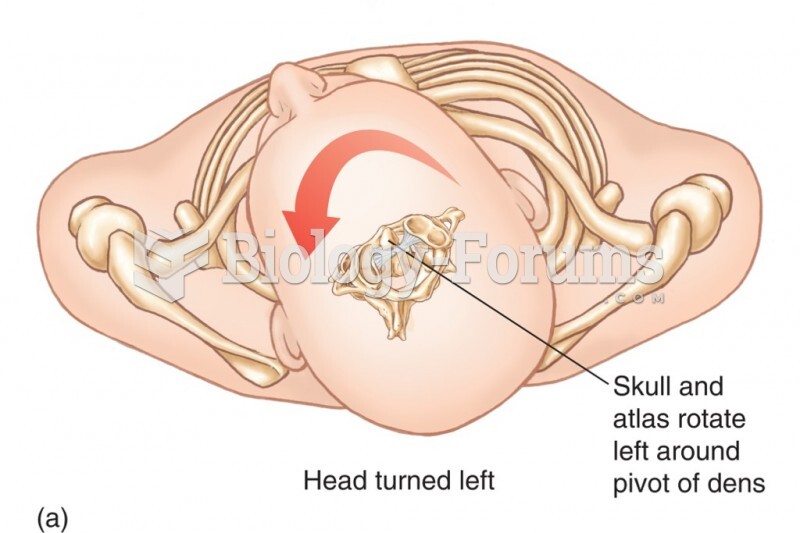 Relationship Between the Atlas and the Axis. The Dens of the Axis Provides a Pivotal Point Around Wh