This topic contains a solution. Click here to go to the answer
|
|
|

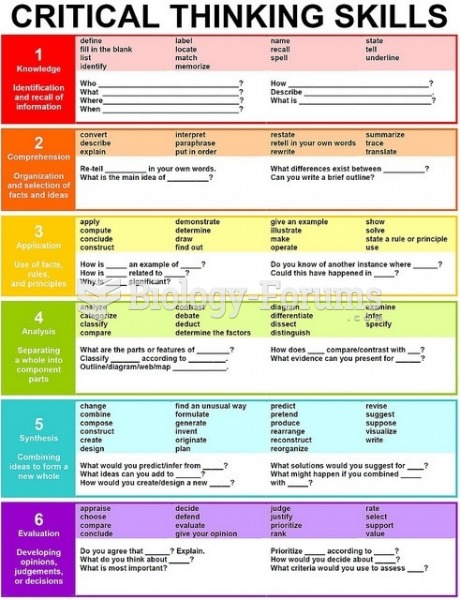 Critical Thinking Skills chart
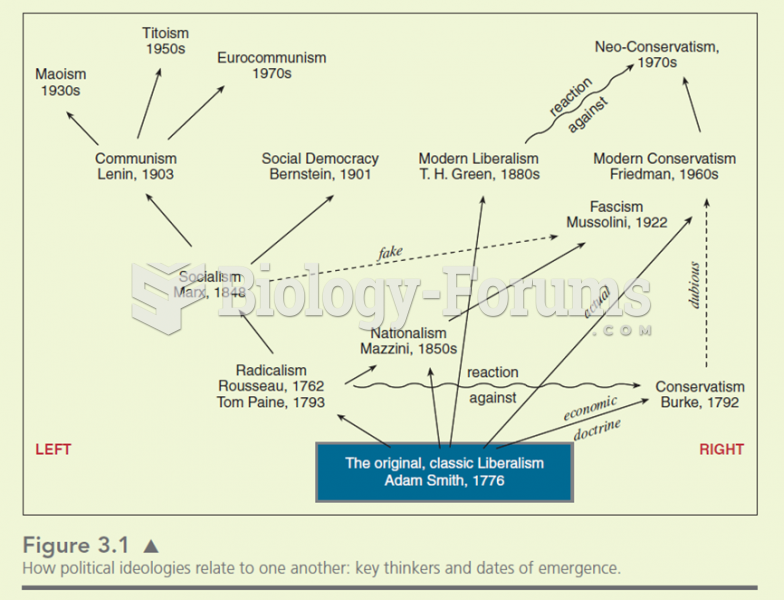 Many ideologies stem from older theories. The ideas of the philosophers are simplified. Ideologies
 Sample root cause analysis: Duplicate dose of a narcotic analgesic.
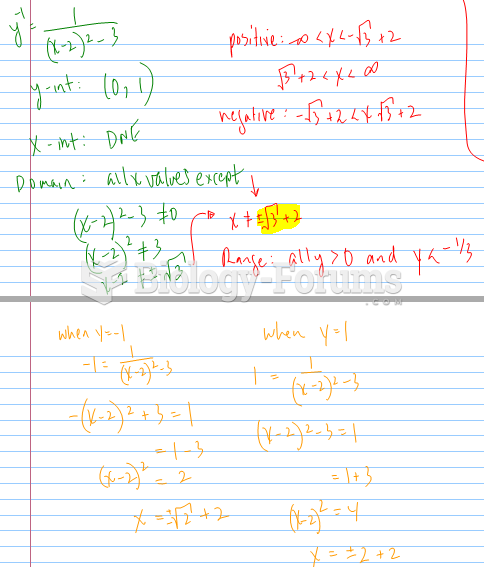 Reciprocal Analysis
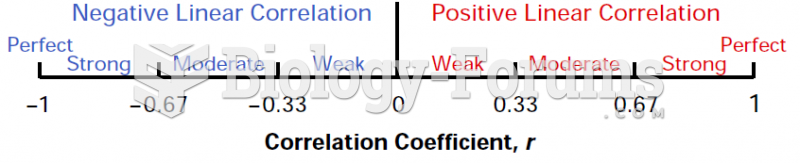 Correlation Coefficient, r (Chart)
 Use of reporter gene in promoter analysis of the even-skipped (eve) gene