This topic contains a solution. Click here to go to the answer
|
|
|

 Perspective analysis of Duccio, Annunciation of the Death of the Virgin, from the Maestà ...
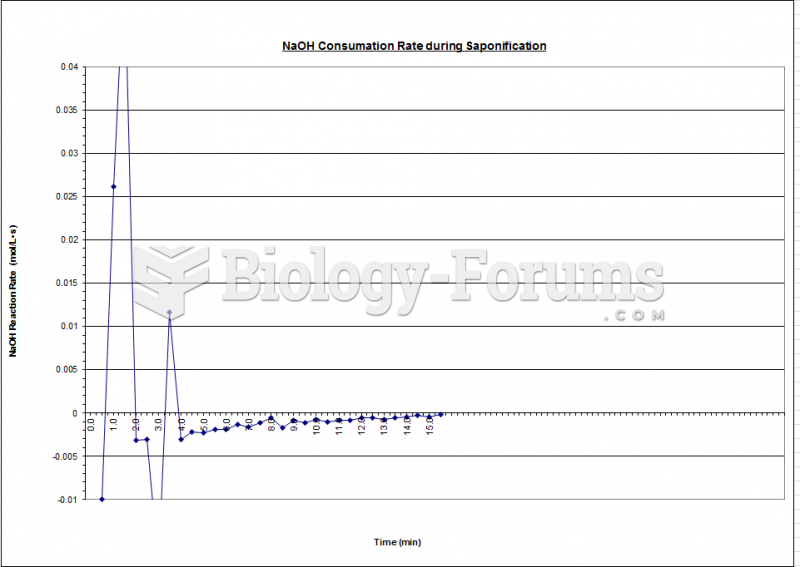 Fluidization - Reaction Rate Chart
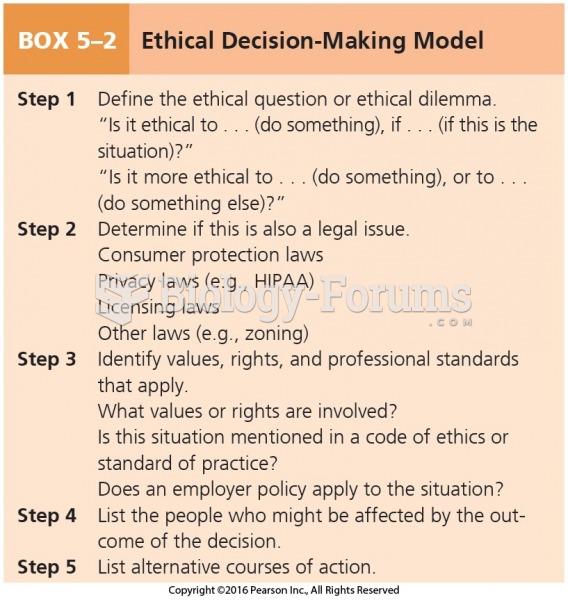 Ethical Decision-Making Model
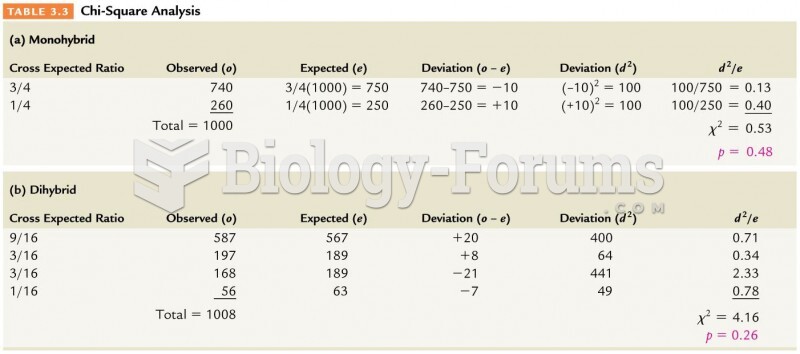 Chi -Squared Analysis
 GENETIC ANALYSIS
 GENETIC ANALYSIS