This topic contains a solution. Click here to go to the answer
|
|
|

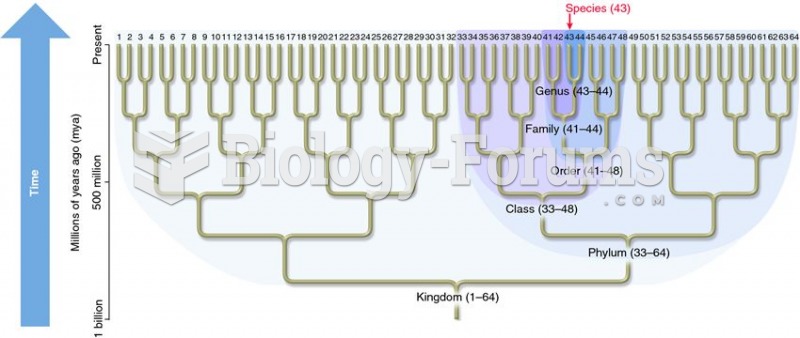 Schematic relationship between a phylogenetic tree and taxonomy.
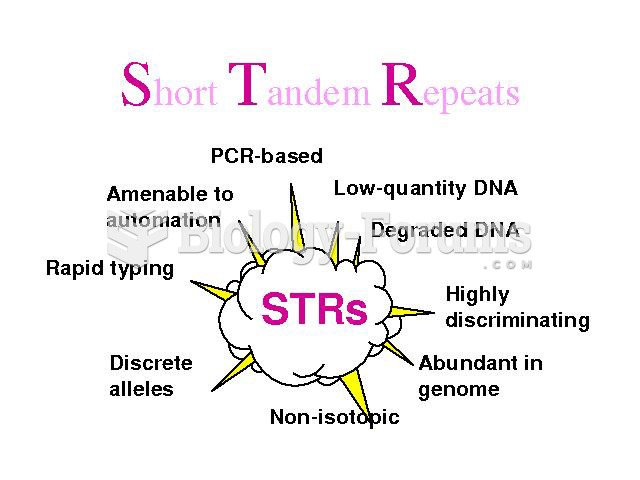 STR DNA Analysis Technique
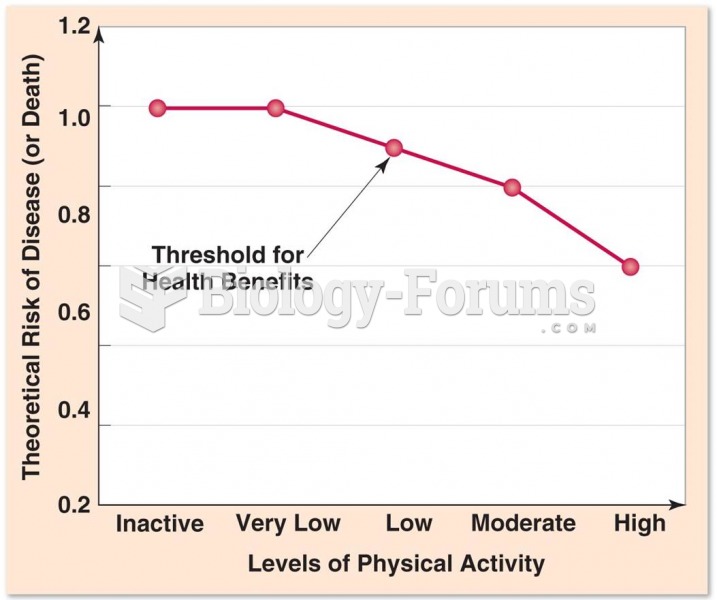 Relationship Between Physical Activity and Improved Health Benefits
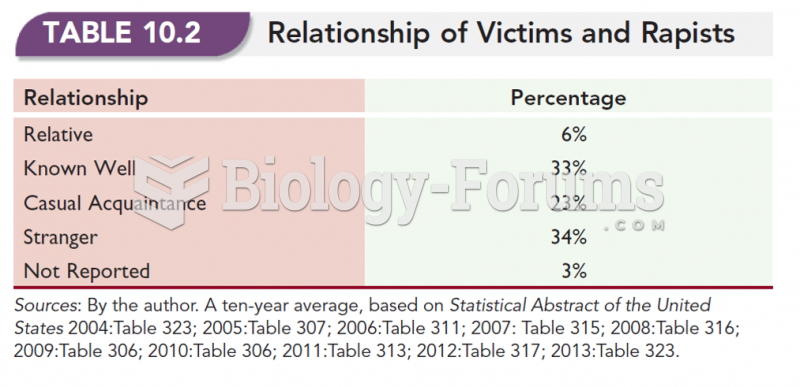 Relationship of Victims and Rapists
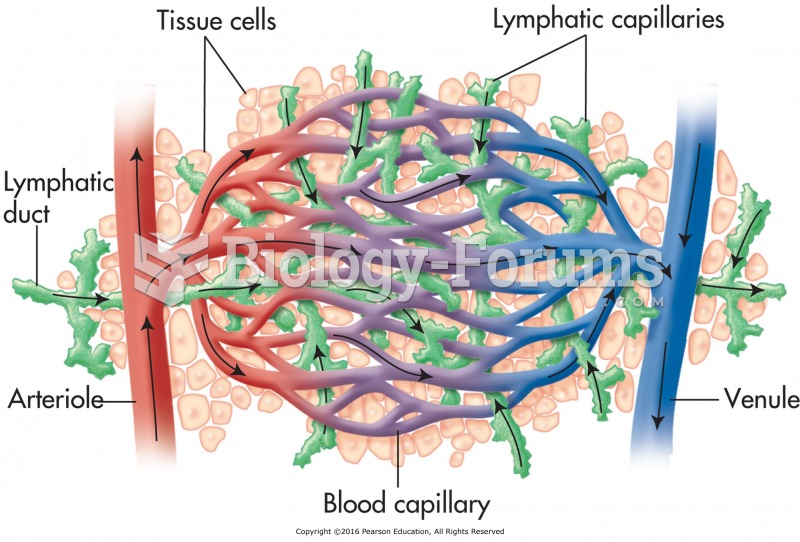 Relationship between blood and lymph capillaries.
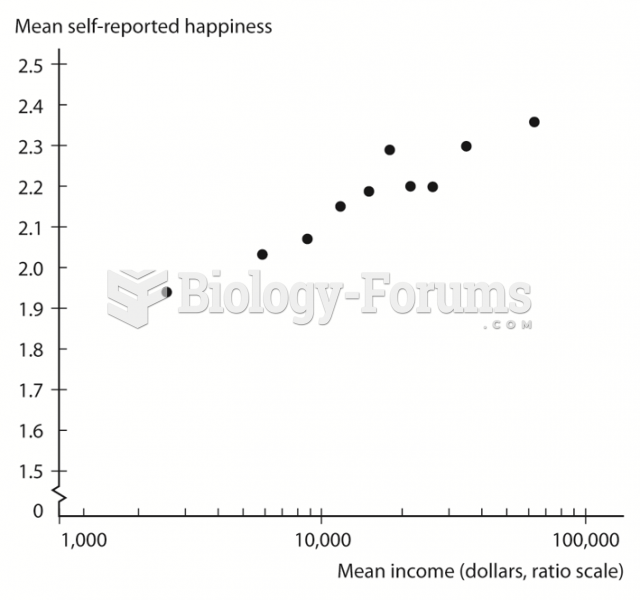 Relationship between Income and Happiness in the United States