This topic contains a solution. Click here to go to the answer
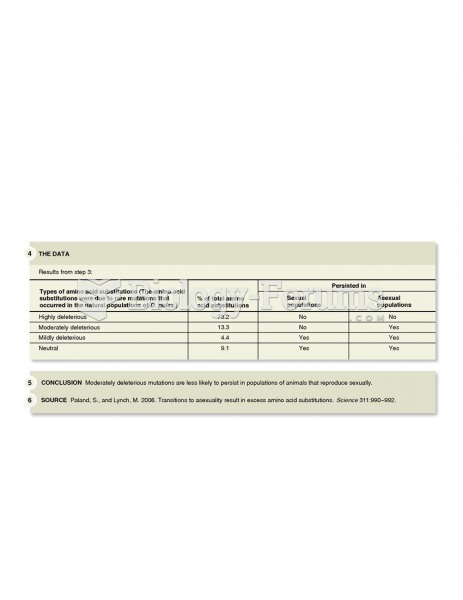
Author Question: A frequency table indicates how many observations fall within each category, and a histogram is its ... (Read 41 times)

javeds

  • Hero Member
  • *****
  • Posts: 570
A frequency table indicates how many observations fall within each category, and a histogram is its graphical analog.
 a. True
  b. False
   Indicate whether the statement is true or false

Question 2

One clue to the presence of multicollinearity is an independent variable known to be an important predictor that ends up having a regression coefficient that is not ___________________ _.
 Fill in the blank(s) with correct word


Related Topics

Need homework help now?

Ask unlimited questions for free

Ask a Question
Marked as best answer by a Subject Expert

nickk12214

  • Sr. Member
  • ****
  • Posts: 332
Answer to Question 1

TRUE

Answer to Question 2

significant


javeds

  • Member
  • Posts: 570
Reply 2 on: Jun 24, 2018
Wow, this really help


mammy1697

  • Member
  • Posts: 341
Reply 3 on: Yesterday
Great answer, keep it coming :)


Did you know?

The B-complex vitamins and vitamin C are not stored in the body and must be replaced each day.

Did you know?

More than 34,000 trademarked medication names and more than 10,000 generic medication names are in use in the United States.

Did you know?

Most childhood vaccines are 90–99% effective in preventing disease. Side effects are rarely serious.

Did you know?

Most fungi that pathogenically affect humans live in soil. If a person is not healthy, has an open wound, or is immunocompromised, a fungal infection can be very aggressive.

Did you know?

The most destructive flu epidemic of all times in recorded history occurred in 1918, with approximately 20 million deaths worldwide.

For a complete list of videos, visit our video library