This topic contains a solution. Click here to go to the answer
|
|
|

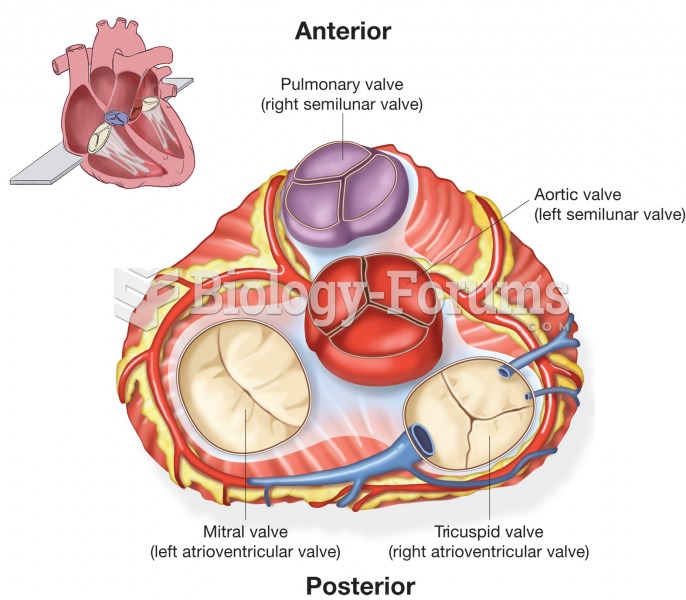 Superior view of heart valves illustrating position, size, and shape of each valve.
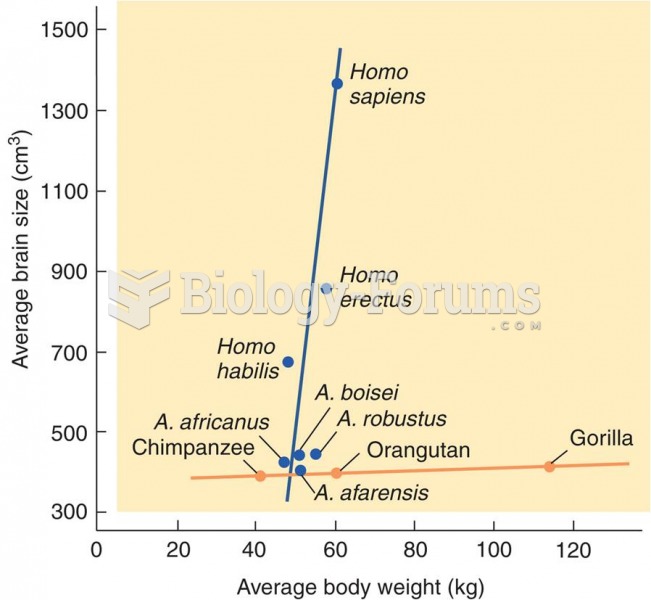 Hominid Brain Size
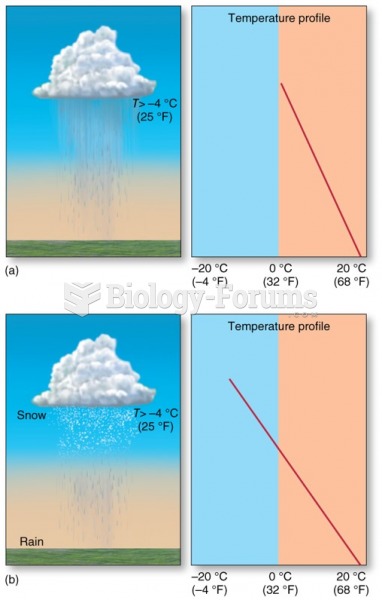 Distribution and Forms of Precipitation: Rain
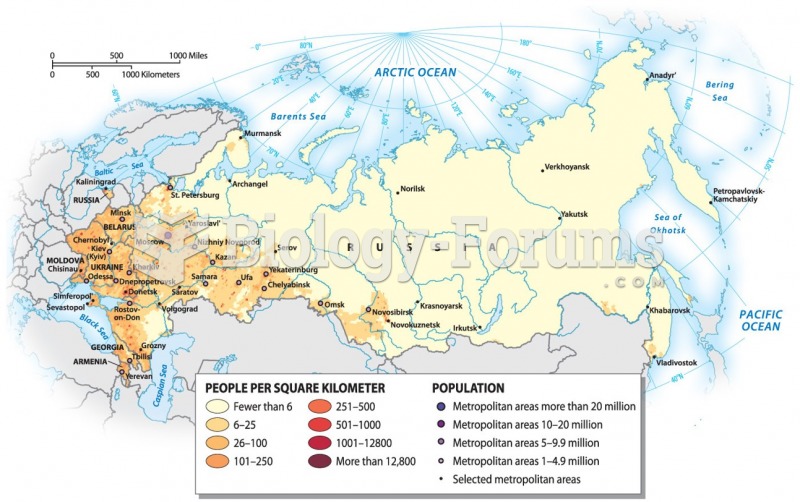 Population Distribution
 Income Distribution in the United States, 2009
 graph
graph