This topic contains a solution. Click here to go to the answer
|
|
|

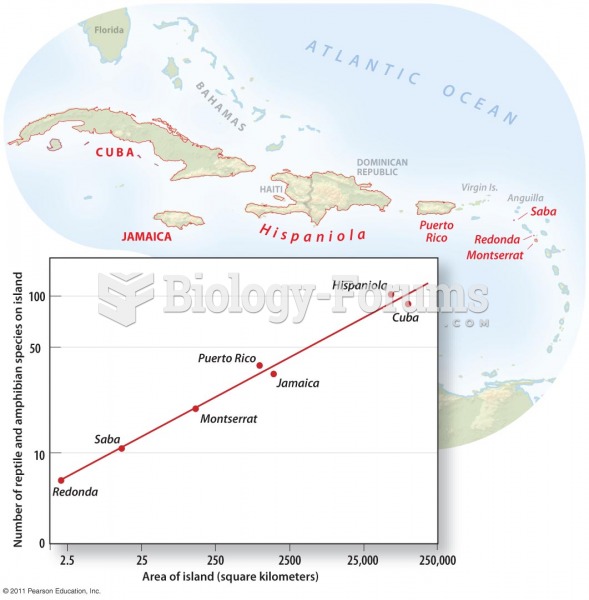 Biodiversity Depends on the Size of Habitat
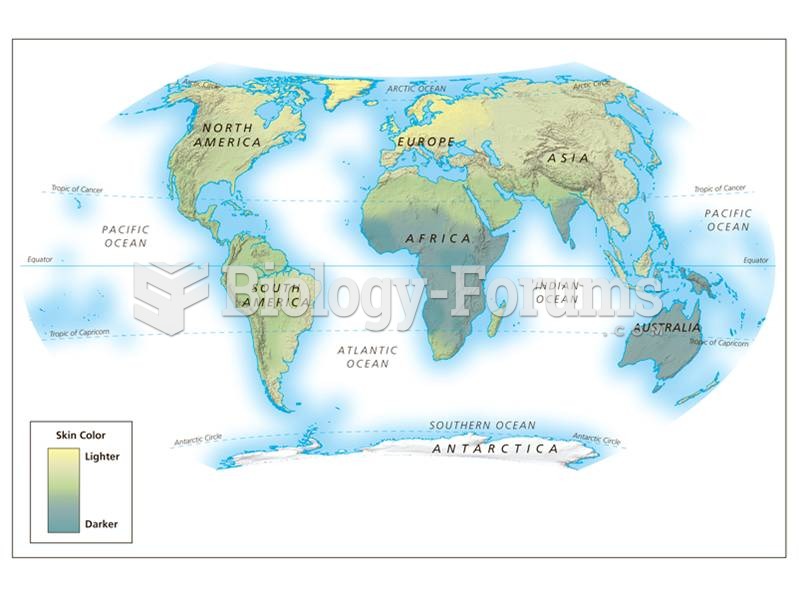 World map of the distribution of skin color.
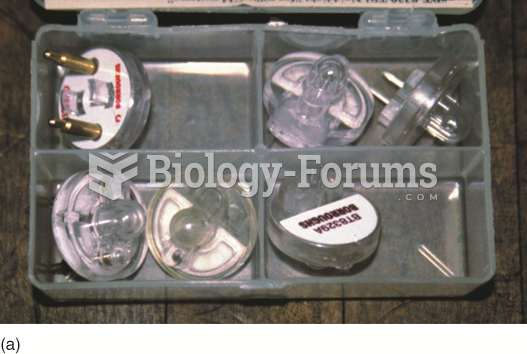 Noid lights are usually purchased as an assortment so that one is available for any type or size ...
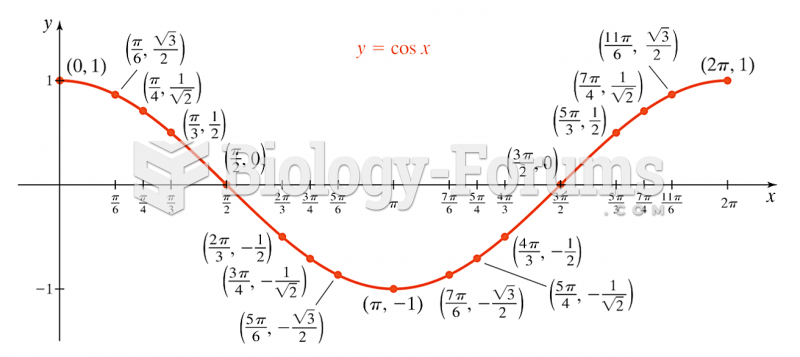 Graph of cos(x)
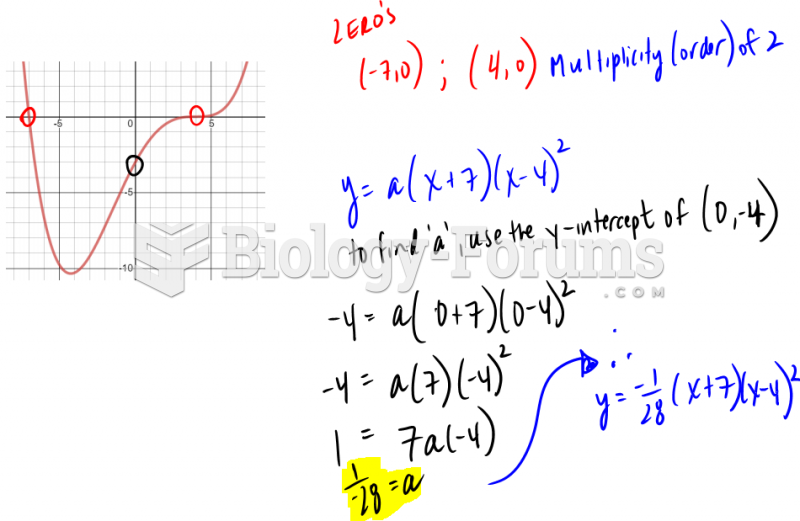 Converting cubic graph to function
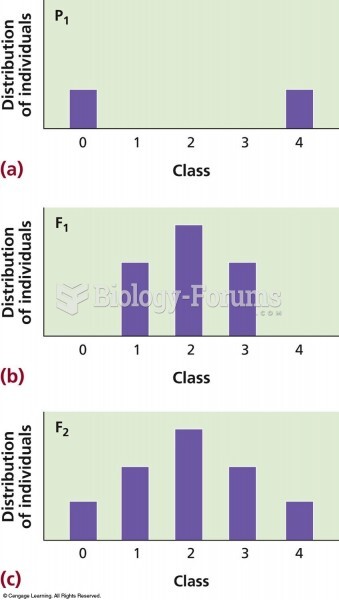 Frequency diagrams of skin colors. (a) Skin color distribution in the parents falls into two discont