This topic contains a solution. Click here to go to the answer
|
|
|

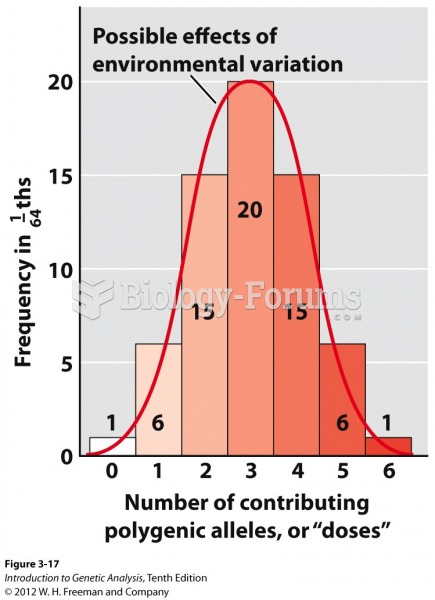 Histogram of polygenes from a trihybrid self
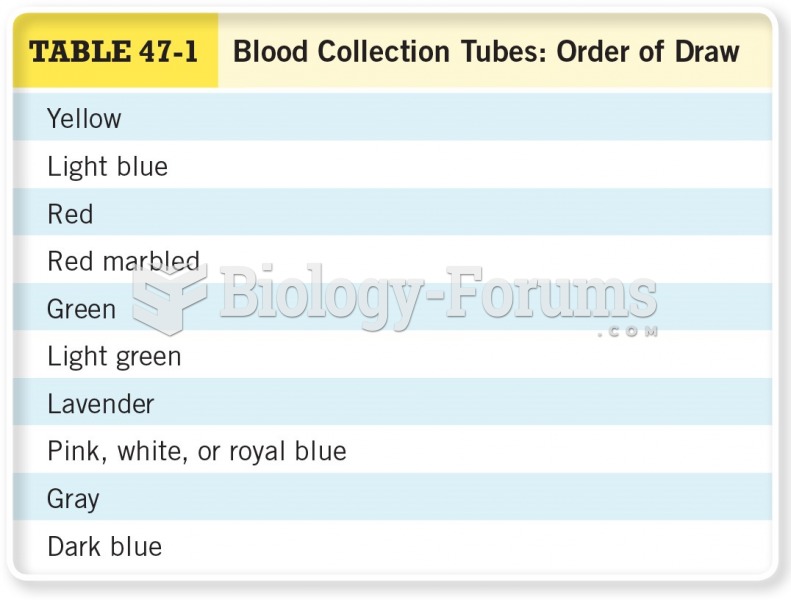 Blood Collection Tubes: Order of Draw
 Demonstrating the use of venipuncture equipment. Using a syringe to draw blood.
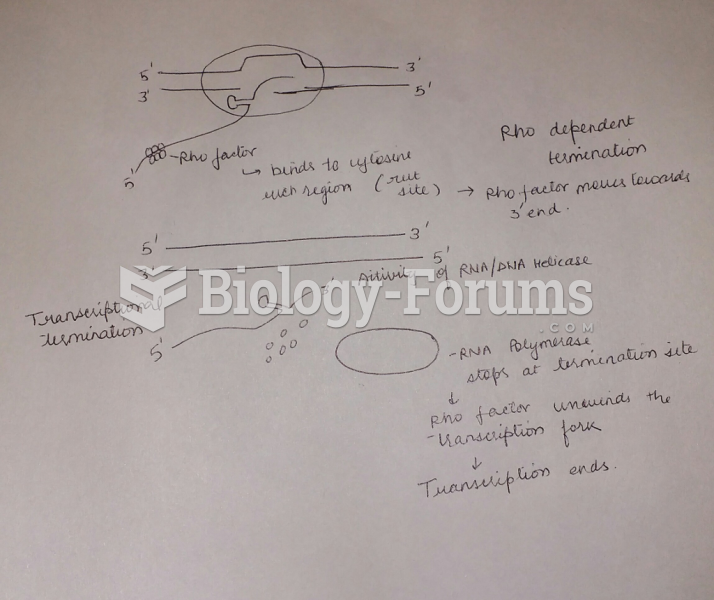 Draw and label a diagram and explain how a factor-dependent transcription (rho-dependent) terminator
 Please fully explain in detail
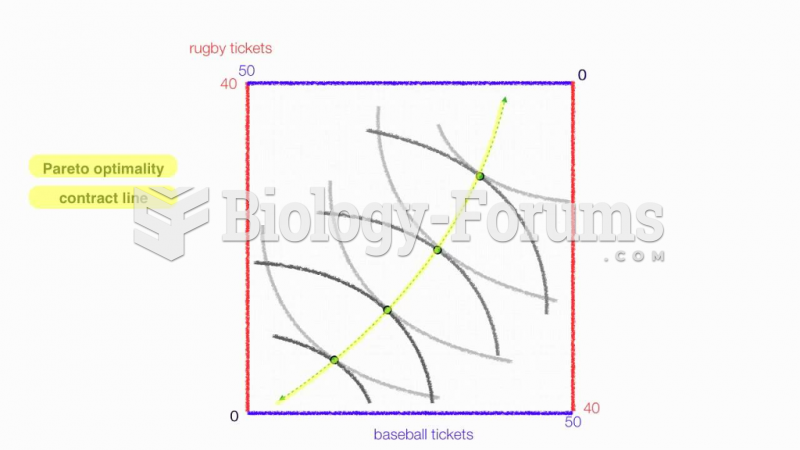 Draw an Edgeworth box for two consumers over two goods