You have collected data on the monthly seasonally adjusted civilian unemployment rate for the United States over a 10-year period. Which of the following is the best for presenting the data?
A) a stem-and-leaf display B) a side-by-side bar chart
C) a contingency table D) a time-series plot
Question 2
You have collected data on the number of U.S. households actively using online banking and/or online bill payment over a 10-year period. Which of the following is the best for presenting the data?
A) a time-series plot B) a side-by-side bar chart
C) a pie chart D) a stem-and-leaf display

 Dimensions for gathering data
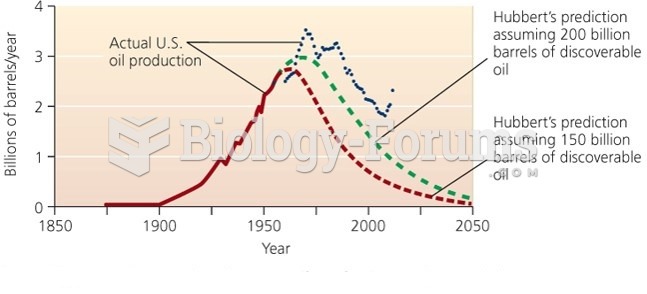 Hubbard’s Predication of Peak in U.S Oil Production with Actual Data
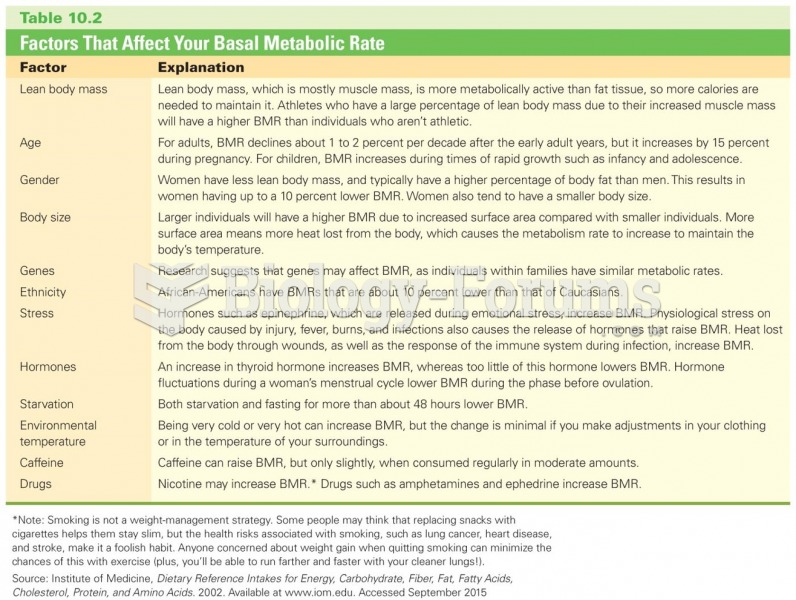 Factors That Affect Your Basal Metabolic Rate
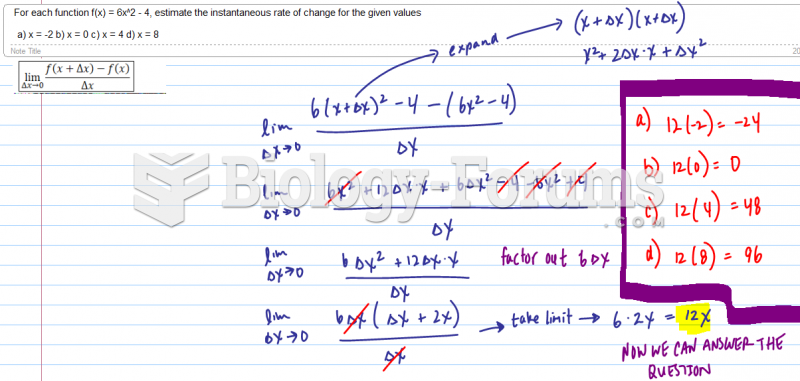 For each function f(x) = 6x^2 - 4, estimate the instantaneous rate of change for the given ...
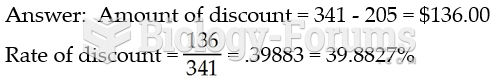 Compute the rate of discount allowed on a rotor-tiller that lists for $341.00 and is sold for ...
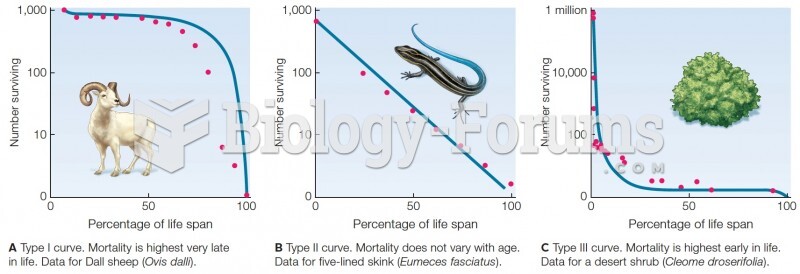 Survivorship curves. Blue lines are theoretical curves. Red dots are data from field studies.