You have collected data on the monthly seasonally adjusted civilian unemployment rate for the United States over a 10-year period. Which of the following is the best for presenting the data?
A) a stem-and-leaf display B) a side-by-side bar chart
C) a contingency table D) a time-series plot
Question 2
You have collected data on the number of U.S. households actively using online banking and/or online bill payment over a 10-year period. Which of the following is the best for presenting the data?
A) a time-series plot B) a side-by-side bar chart
C) a pie chart D) a stem-and-leaf display

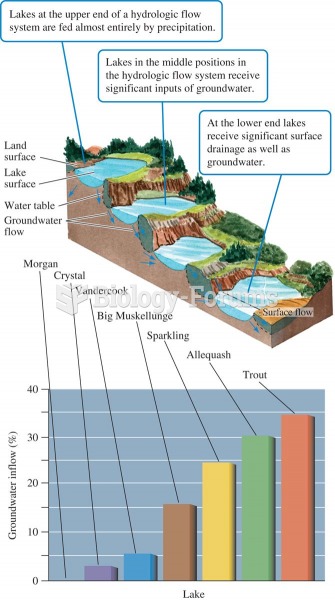 Lake position in the landscape and proportion of water received as groundwater (data from Webster et
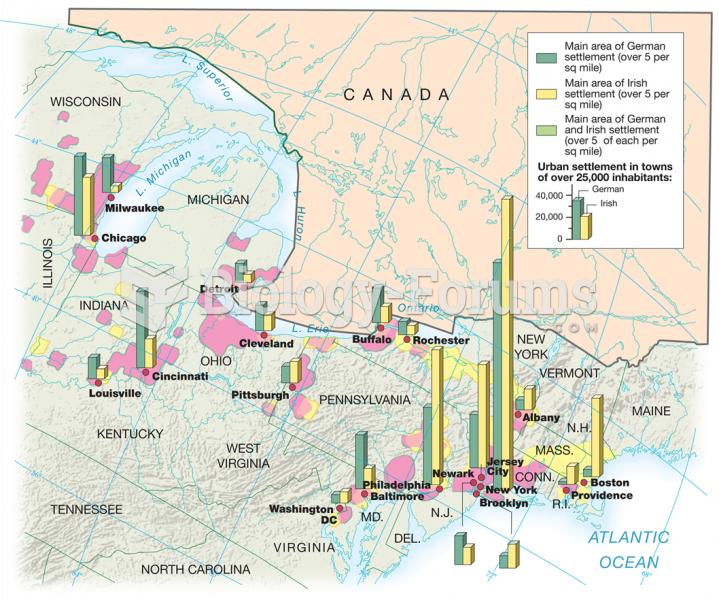 German and Irish Settlement in the Northeastern United States, 1870
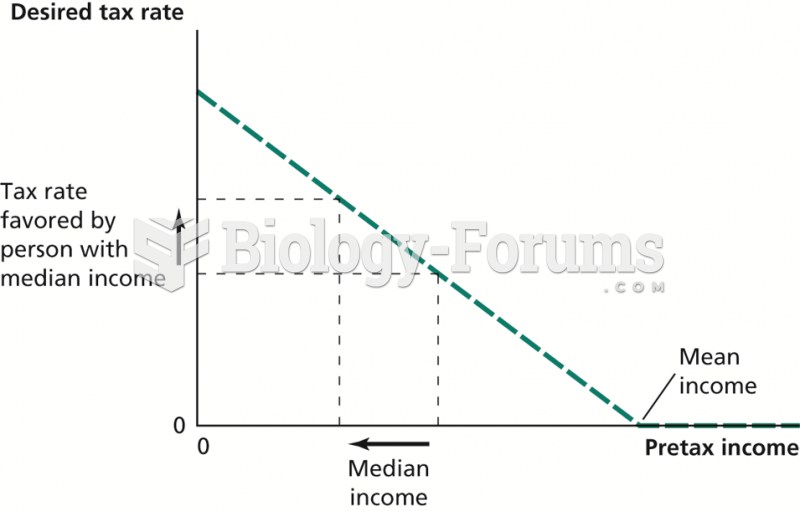 How an Increase in Income Inequality Affects the Desired Tax Rate
 Business Intelligence, Analytics, and Data Science: A Managerial Perspective, 4th Edition
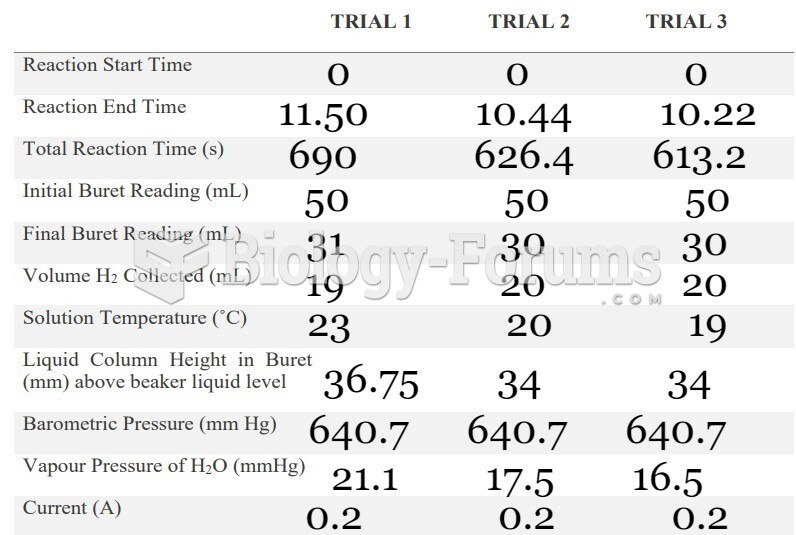 data
data
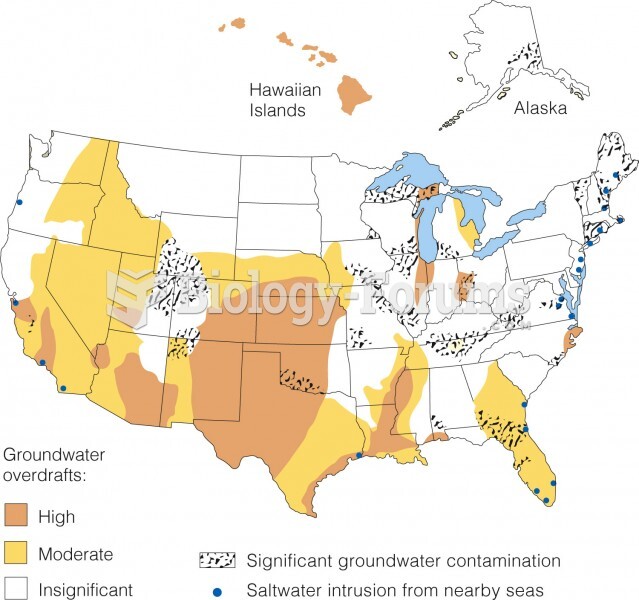 Groundwater troubles in the United States