This topic contains a solution. Click here to go to the answer
|
|
|

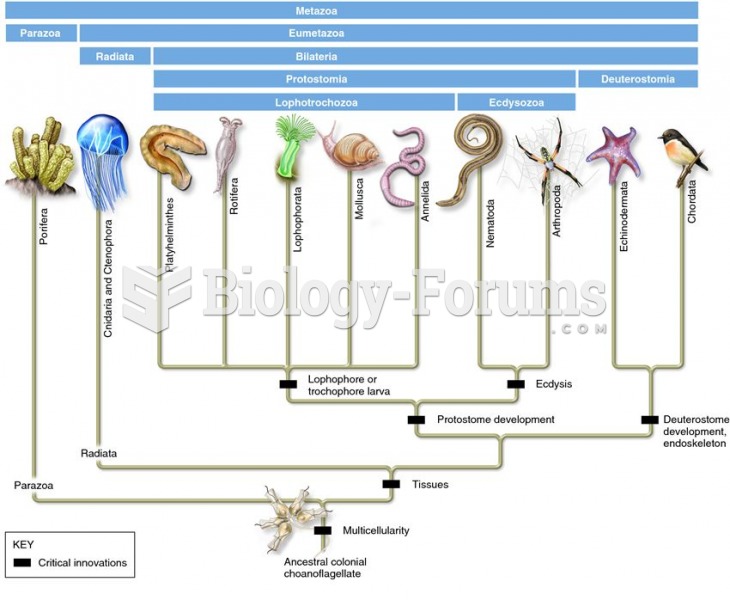 A revised animal phylogeny based on molecular data of SSU rRNA
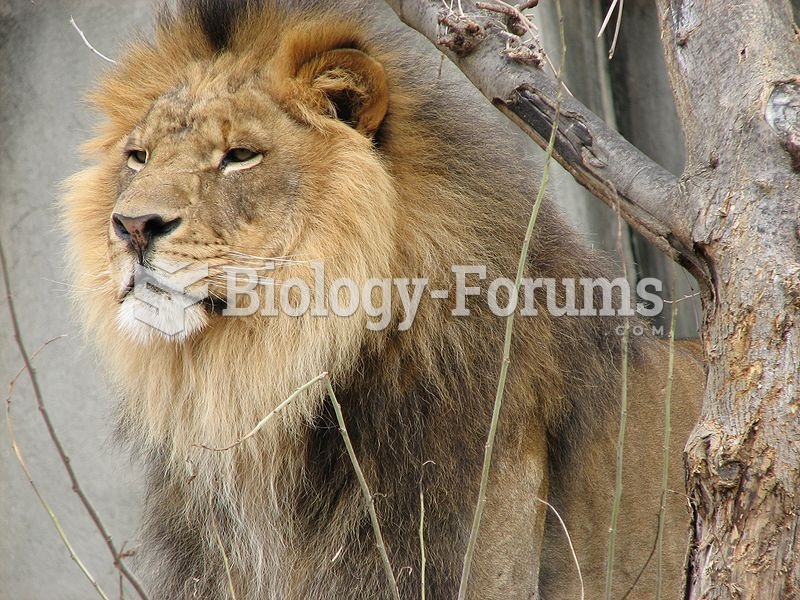 During confrontations with others, the mane makes the lion look larger.
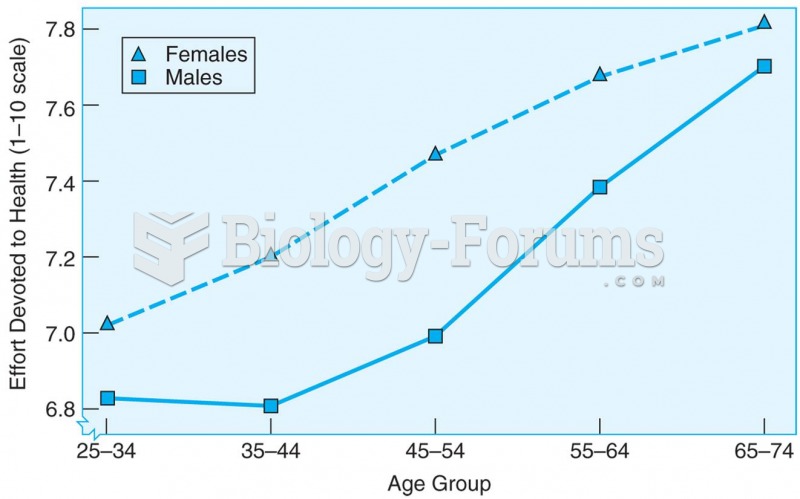 Cross-sectional data showing that the amount of effort spent on personal health care increases with
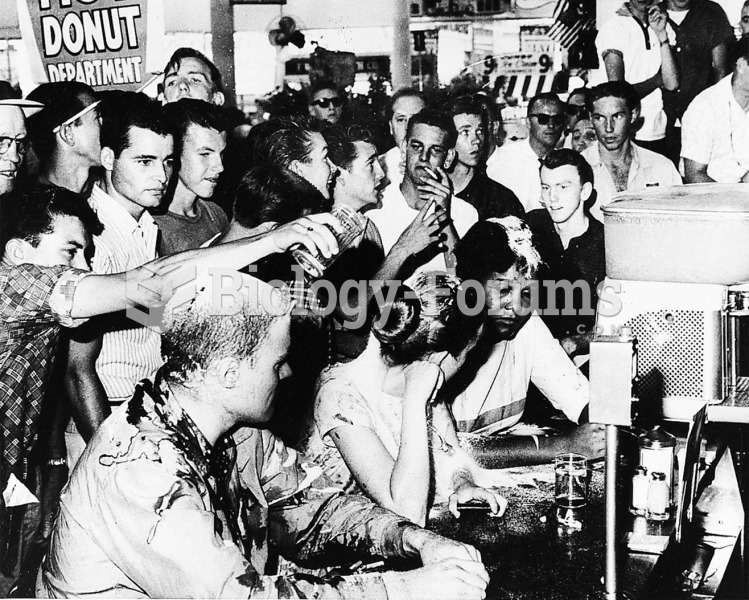 Whites pour mustard and ketchup over black (and white) students who were integrating a lunch counter ...
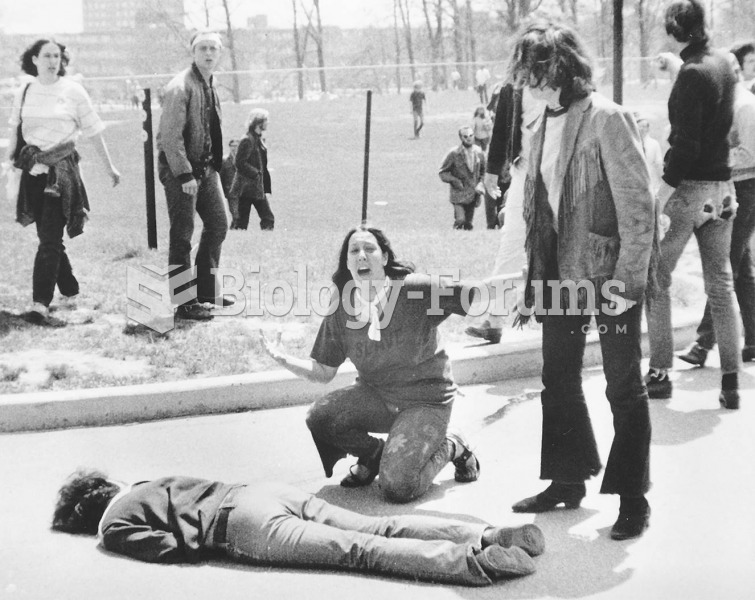 National Guardsmen firing into a crowd of antiwar protesters at Kent State University killed four ...
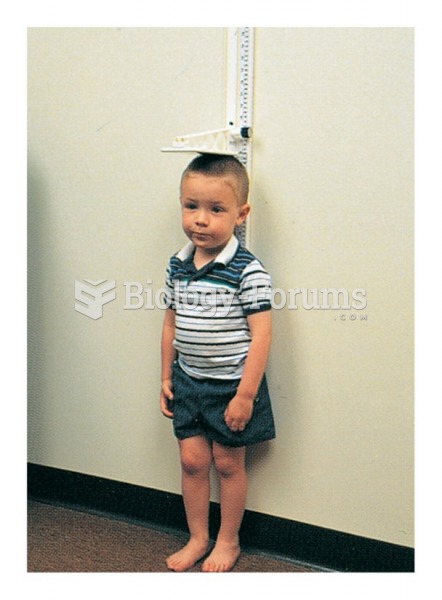 Measuring a child’s height with a measuring stick