This topic contains a solution. Click here to go to the answer
|
|
|

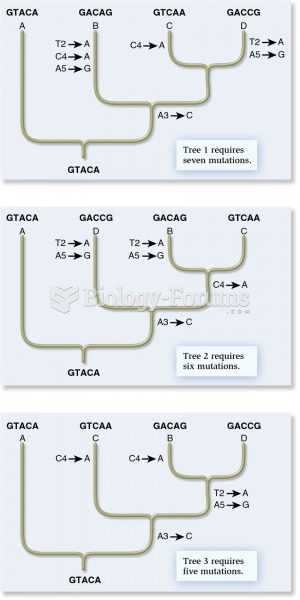 The cladistic approach from molecular genetic data
 Iowa State University's Tornado/Microburst Simulator
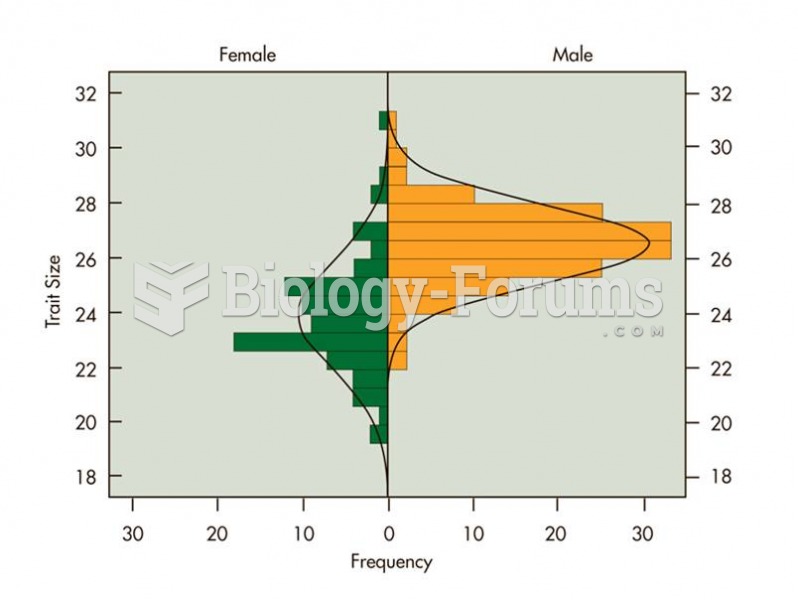 Although males tend to be larger than females, the two overlap significantly in size. The size of a
 Common skin signs are often evidence of an illness or disorder. A nodule is a larger papule; acne ...
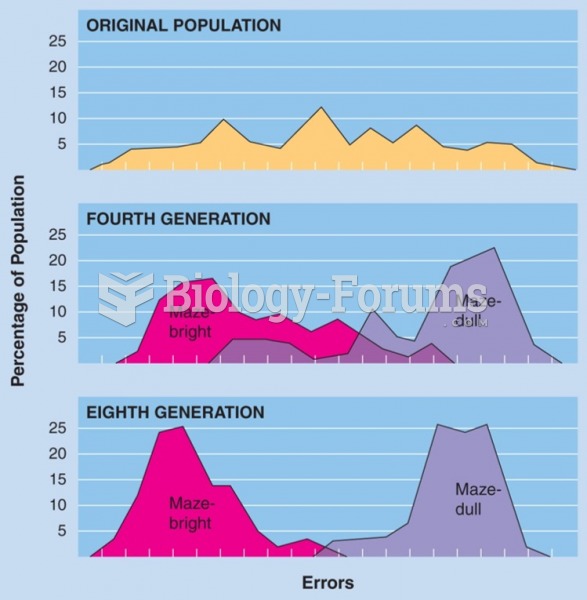 Selective breeding of maze-bright and maze-dull strains of rats by Tryon (1934). (Data from Cooper, ...
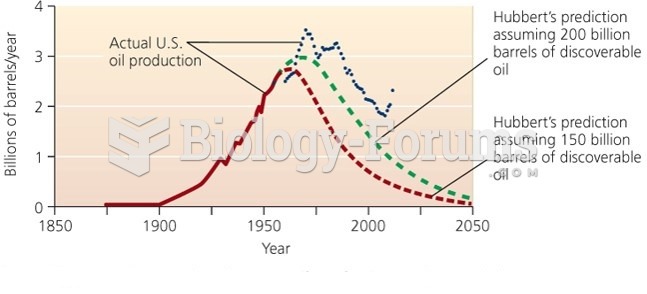 Hubbard’s Predication of Peak in U.S Oil Production with Actual Data