The graph of a discrete random variable looks like a histogram where the probability of each possible outcome is represented by a bar.
Indicate whether the statement is true or false
Question 2
Which of the following is a key difference between a bar chart and a histogram?
A) A bar chart typically has gaps between the bars while a histogram has no gaps.
B) A bar chart is developed to analyze a continuous variable, while a histogram is used to analyze discrete variables.
C) Both A and B are correct.
D) There is actually no real difference between a bar chart and a histogram.

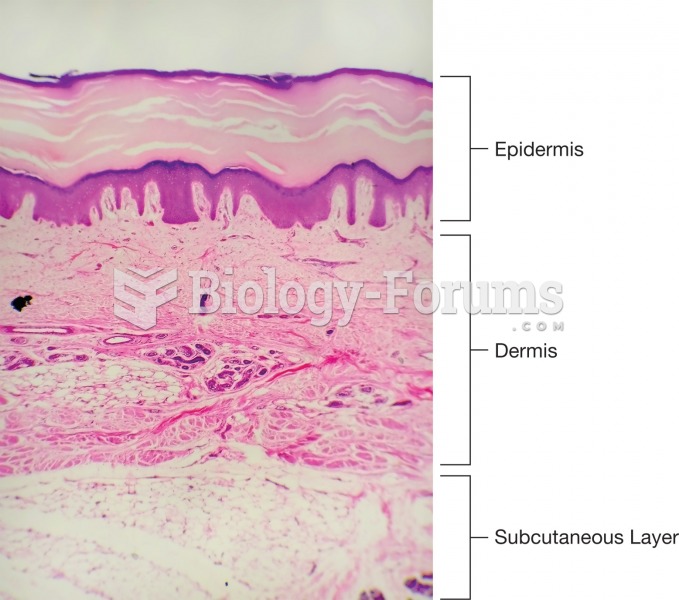 Photomicro graph showing the three layers of the skin.
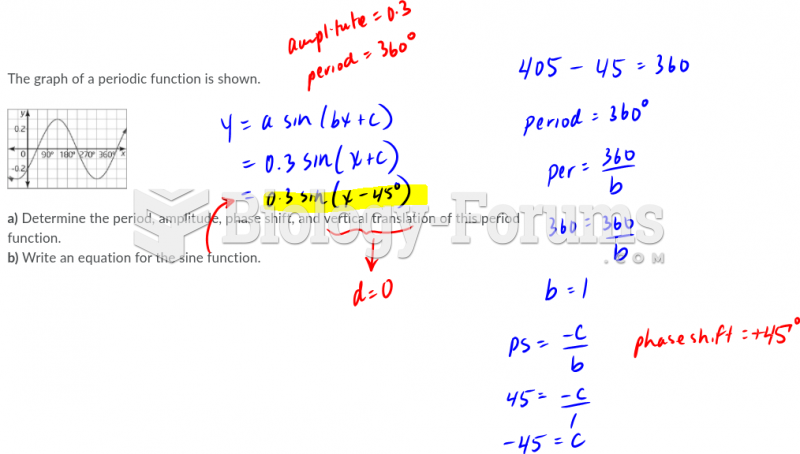
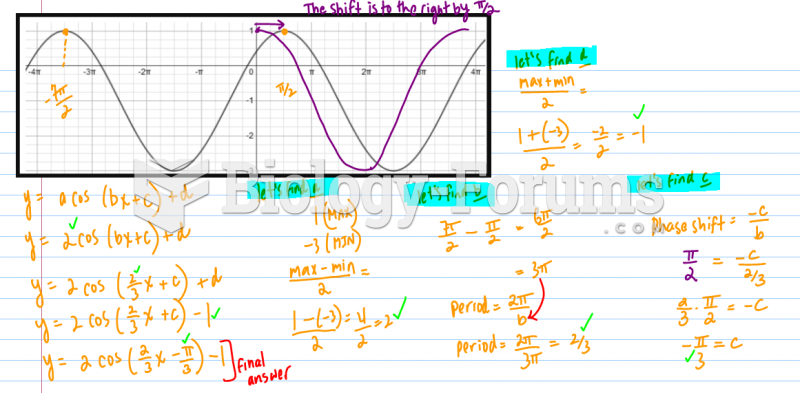 How to find the phase shift from a graph?
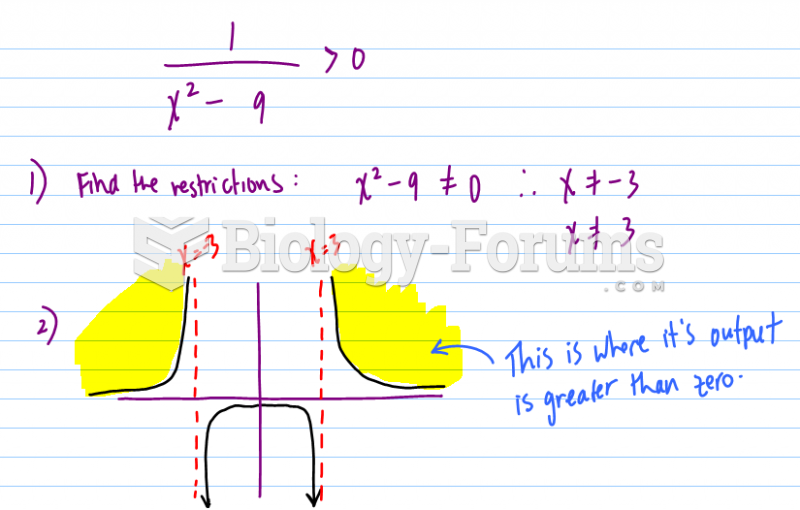 To satisfy the inequality, sketch the following function by hand and shade the graph regions.
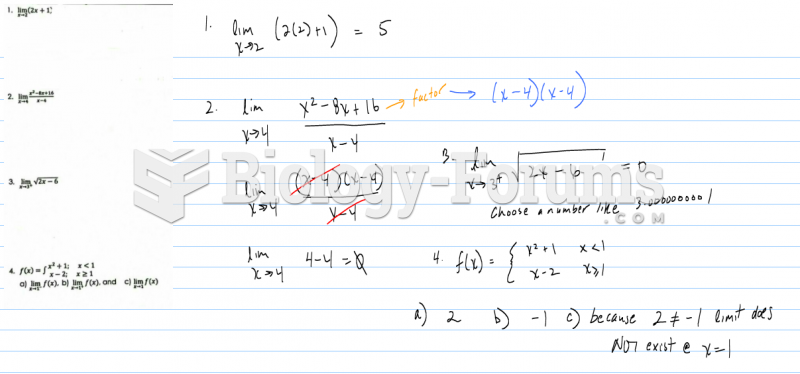 Evaluate then graph the following limits
 Look at the graph function shown belowPlea
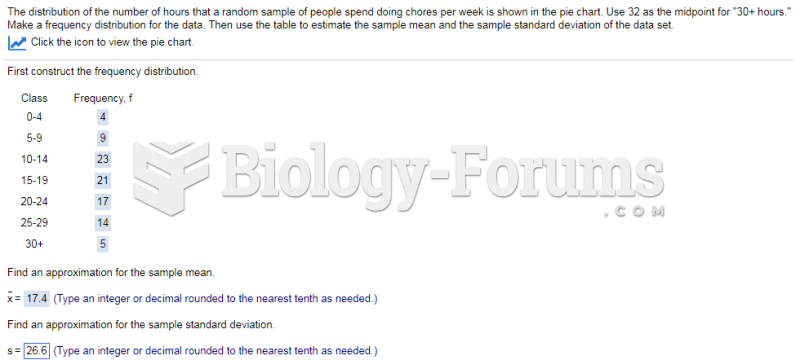 The distribution of the number of hours that a random sample of people spend doing chores per ...