This topic contains a solution. Click here to go to the answer
|
|
|

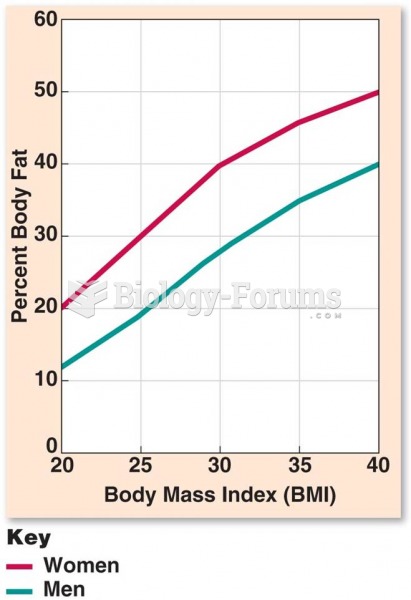 Relationship Between BMI and % BF
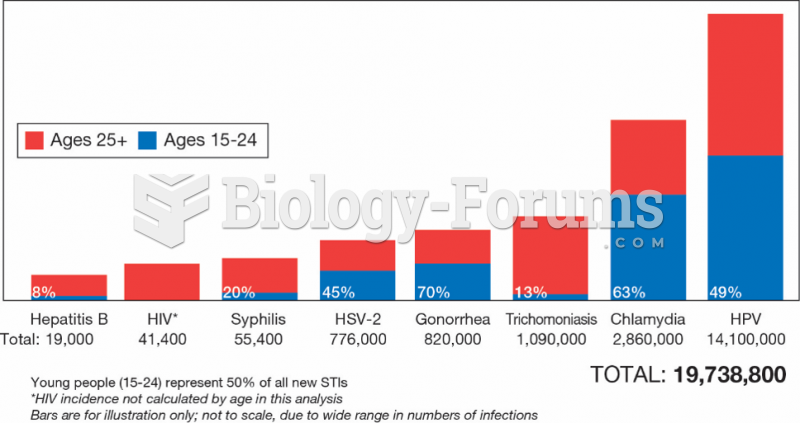 Estimated Number of New Sexually Transmitted Infections
 “Career choice” for many women means leaving their paid jobs for a number of years when they ...
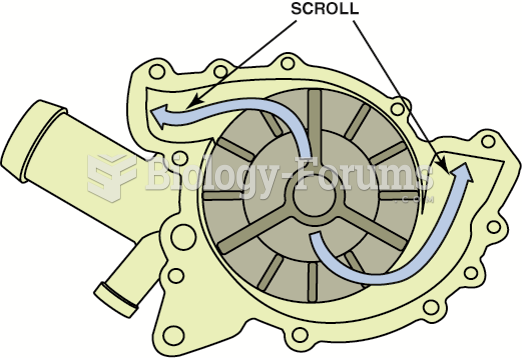 Coolant flow through the impeller and scroll of a coolant pump for a V-type engine.
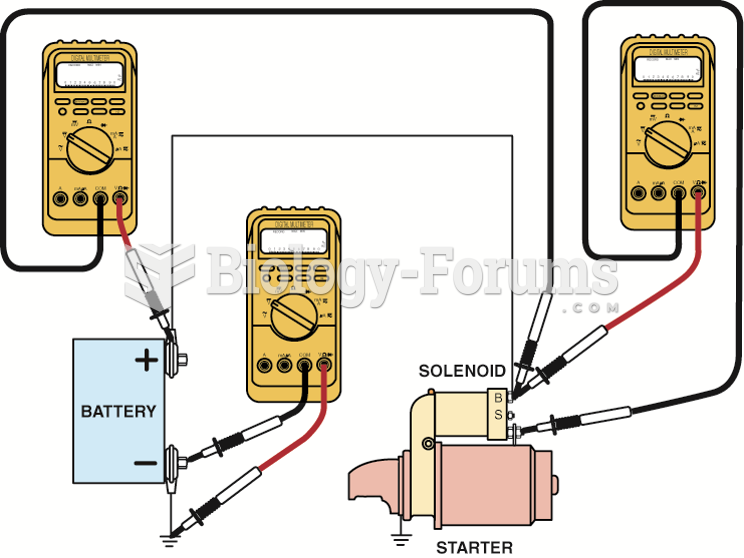 Voltmeter hook-ups for voltage-drop testing of a GM-type cranking circuit.
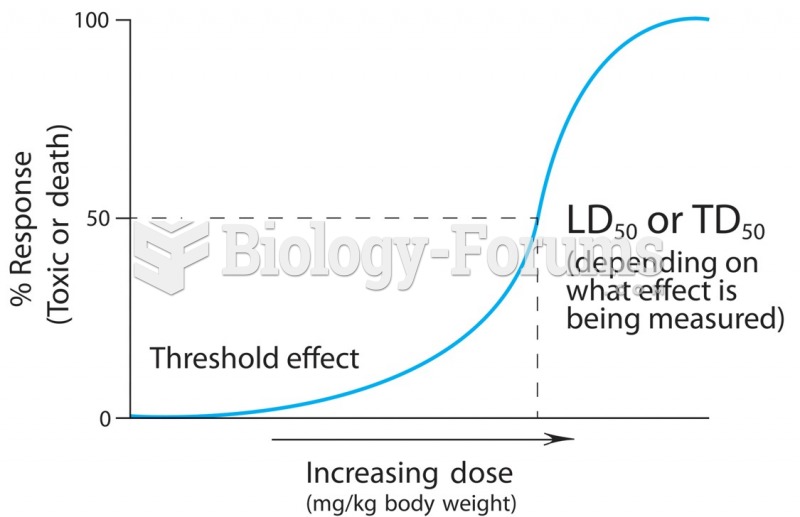 A dose-response curve describes the relationship between the quantity of the chemical entering the ...