This topic contains a solution. Click here to go to the answer
|
|
|

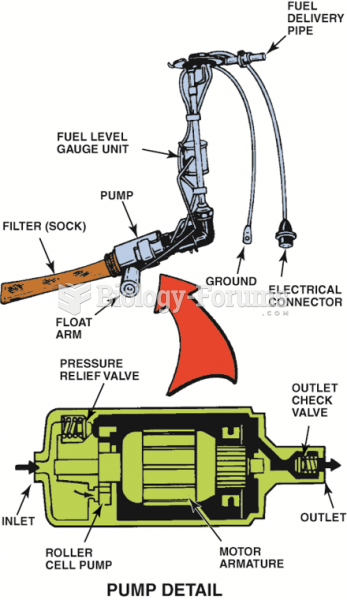 A roller cell-type electric fuel pump.
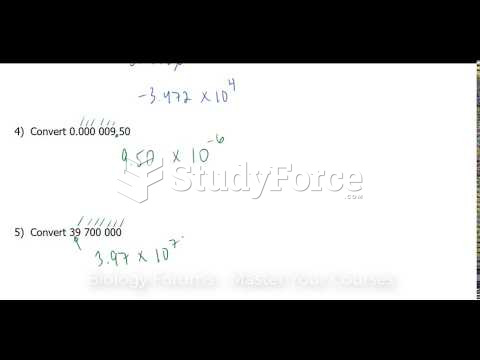 How to write any number in scientific notation
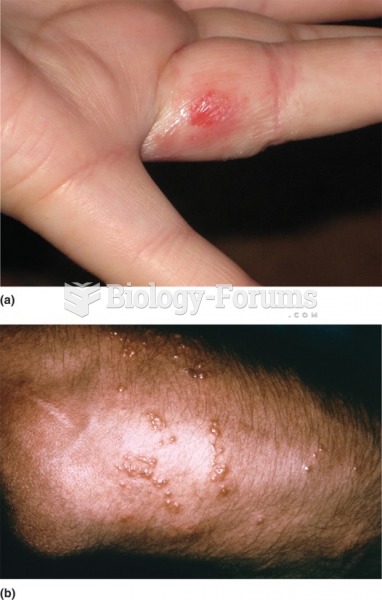 a) Type IV hypersensitivity reaction, contact dermatitis as the result of reaction to the nickel in ...
 Action of type I and type II topoisomerases, as shown by gel electrophoresis
 Most elderly enjoy maintaining relationship with their grandkids
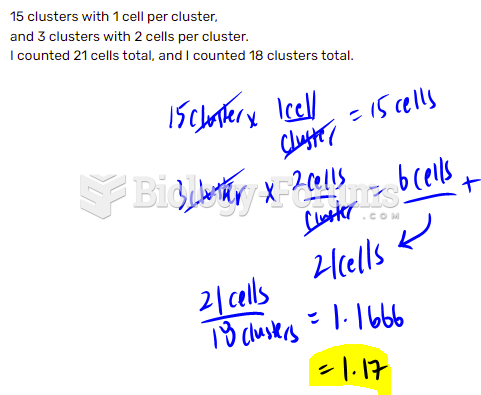 What would your average (mean) number of cells per cluster be?