In situations involving two or more variables, both histograms and bar charts can be used for multiple variables on the same graph.
Indicate whether the statement is true or false
Question 2
A cell phone service provider has selected a random sample of 20 of its customers in an effort to estimate the mean number of minutes used per day.
The results of the sample included a sample mean of 34.5 minutes and a sample standard deviation equal to 11.5 minutes. Based on this information, and using a 95 percent confidence level:
A) the critical value is z = 1.96
B) the critical value is z = 1.645
C) the critical value is t = 2.093
D) The critical value can't be determined without knowing the margin of error.

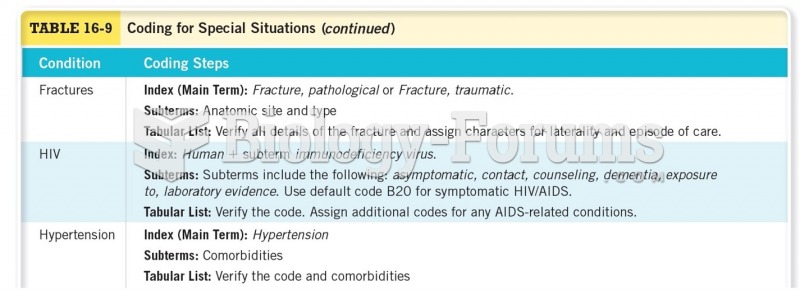 Coding for Special Situations Cont
 How to solve a word problem involving trigonometric models (Question 1)
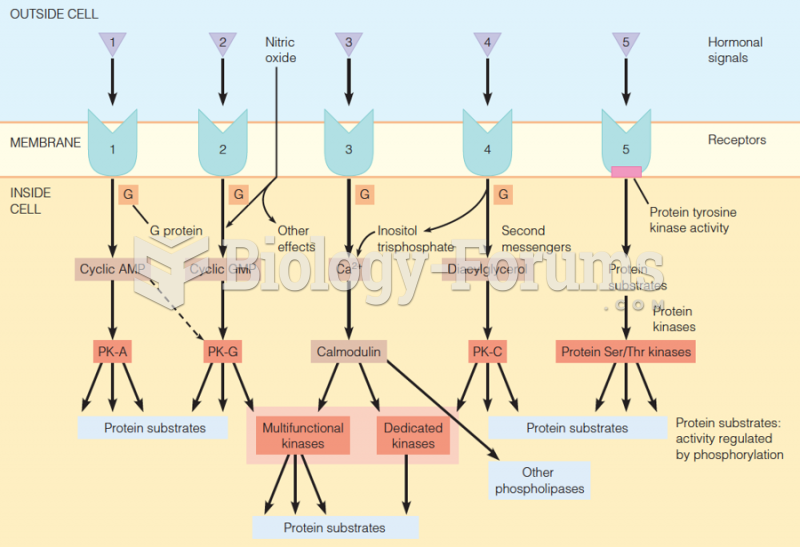 Eukaryotic signal transduction systems involving membrane receptors (1–5)/ second messengers (1-4)
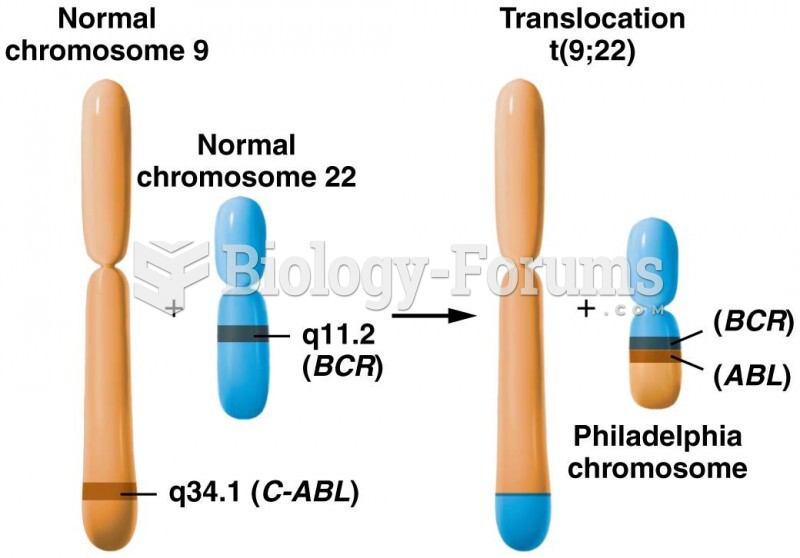 A reciprocal translocation involving the long arms of chromosomes
 Histograms
 Histograms - Analysis and Data