This topic contains a solution. Click here to go to the answer
|
|
|

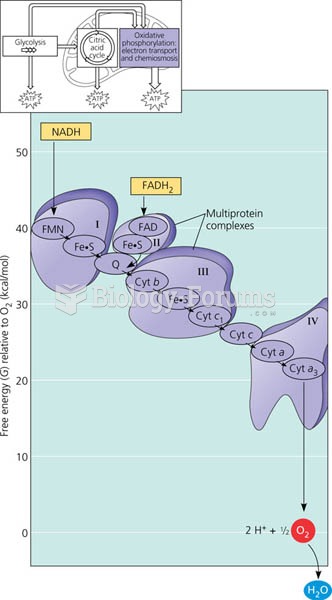 Free energy change during electron transport
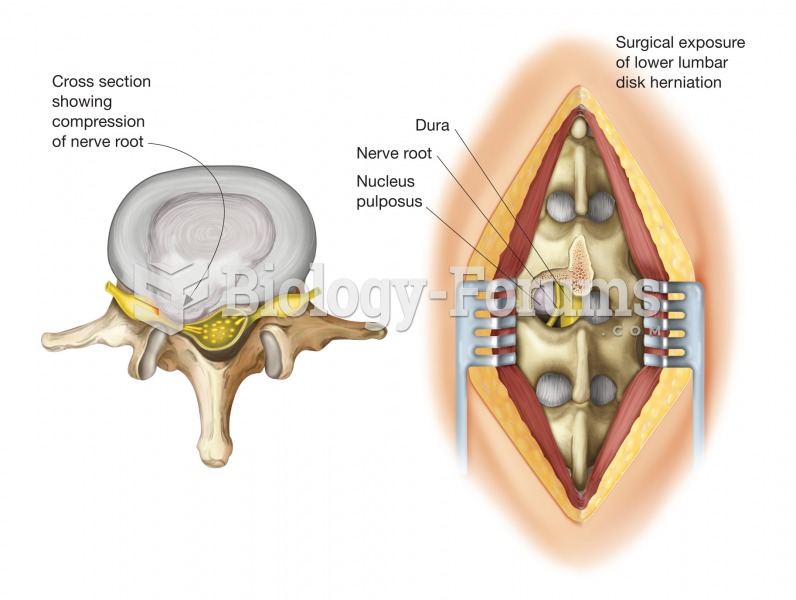 Herniated disk. A herniated disk is a protrusion of the disk’s gelatinous center, called the nucleus
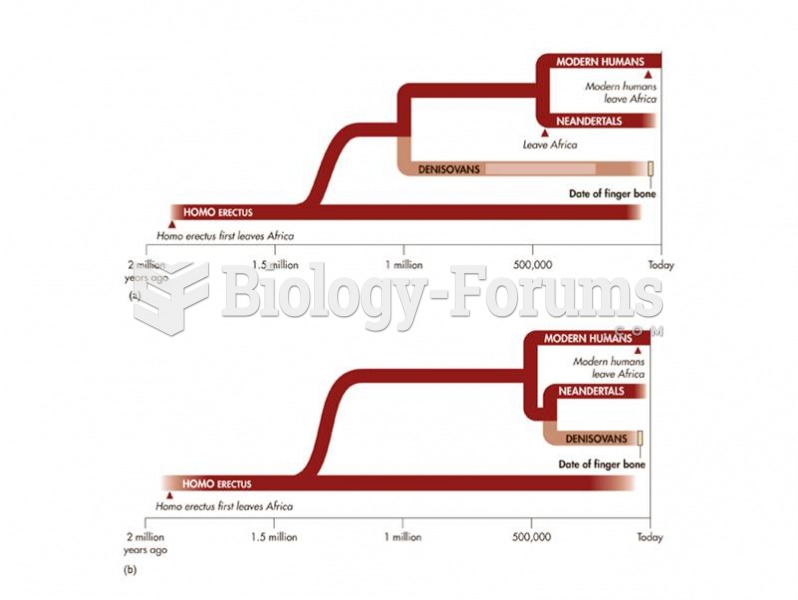 (a) Initial mtDNA results suggested modern humans and Neadertals were equally distantly related to D
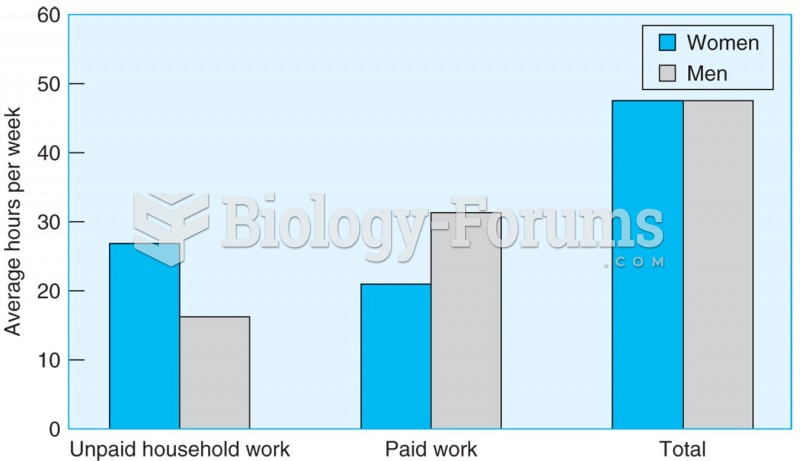 Men and women work the same number of hours a week, but men spend more time on paid work, and women ...
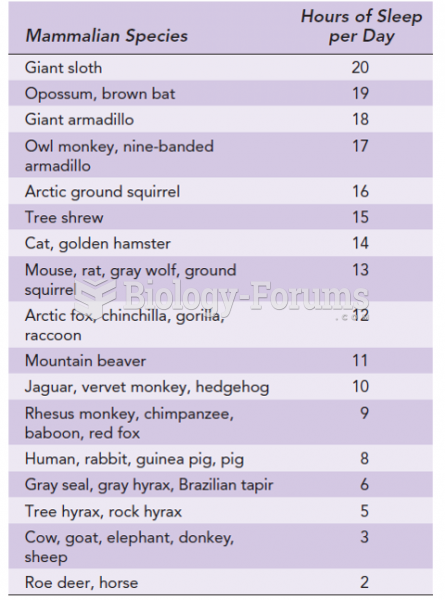 Average Number of Hours Slept per Day by Various Mammalian Species
 A Change of Heart