This topic contains a solution. Click here to go to the answer
|
|
|

 Lateral Cross Section of the Interior Eye
 Cervical cancer (a) Top view of the uterus showing the presence of a tumor in the wall of the cervix
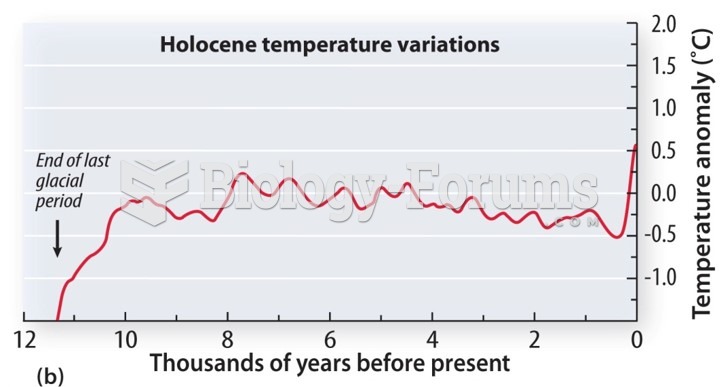 Historical Climate Change "تغير المناخ التاريخي"
 Change is hard at first messy in the middle and gorgeous at the end
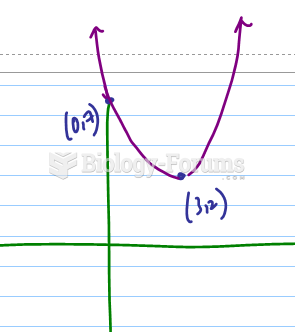 If a graph has the following x-intercepts, which value of x is the instantaneous rate of change ...
 An inventory record sheet shows a balance on hand of 972. During the month units sold were 111, ...