|
|
|

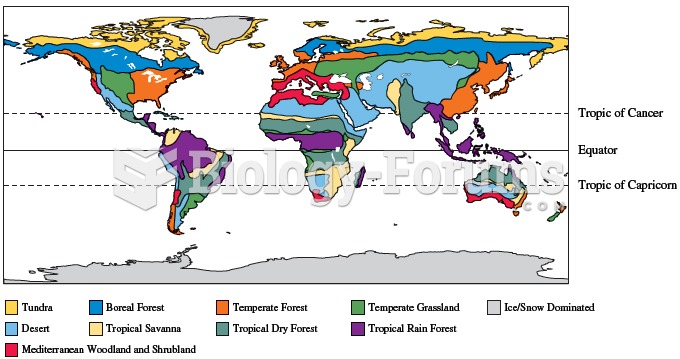 Variation in climatic conditions result in geographic variation in the distribution of biome types a
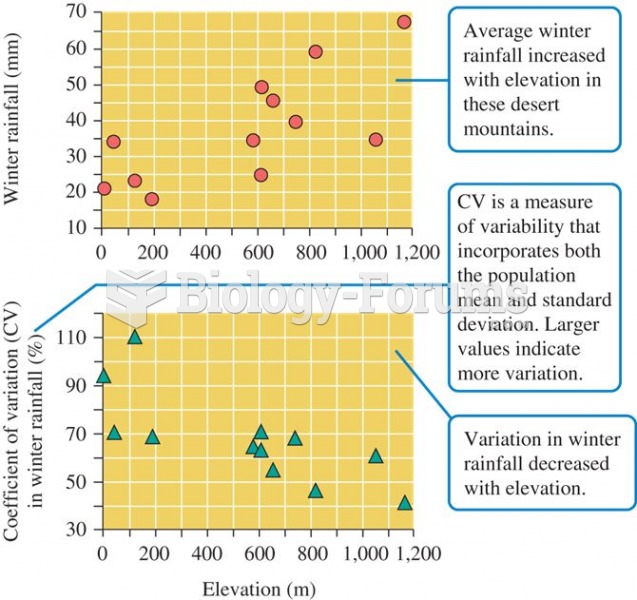 Average winter rainfall and variation in rainfall among sites inhabited by Suromalus ater
 This advertisement from about 1885 represents an early stage of capitalism when individuals were ...
 Group Performance
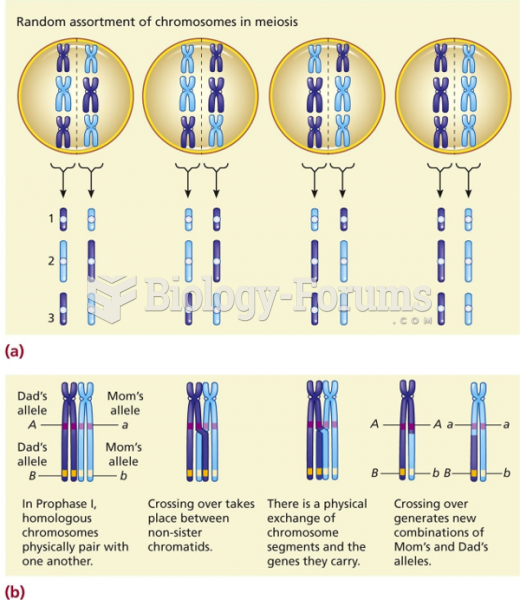 Two ways of generating genetic variation in meiosis
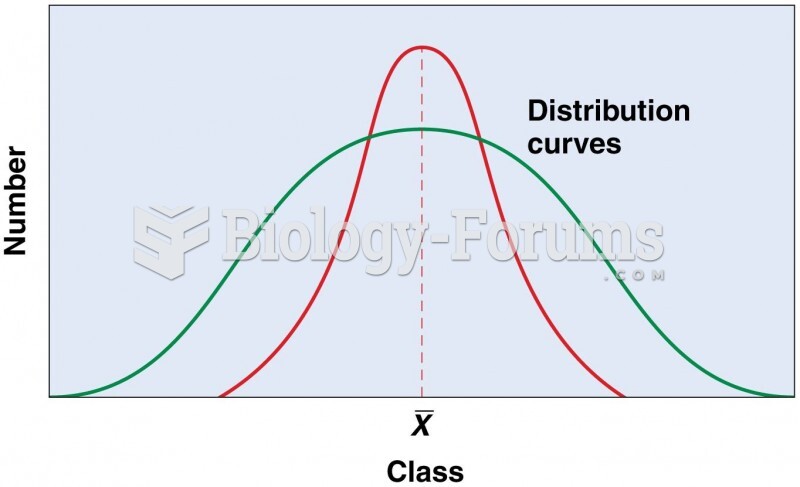 Two normal frequency distributions with the same mean but different amounts of variation