|
|
|

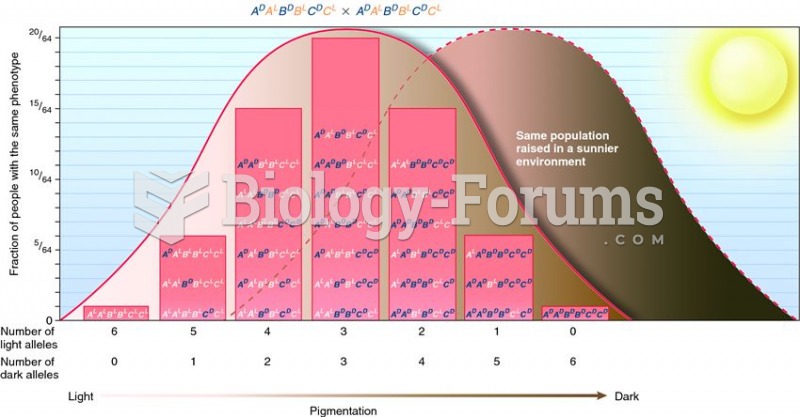 Continuous variation in a polygenic trait.
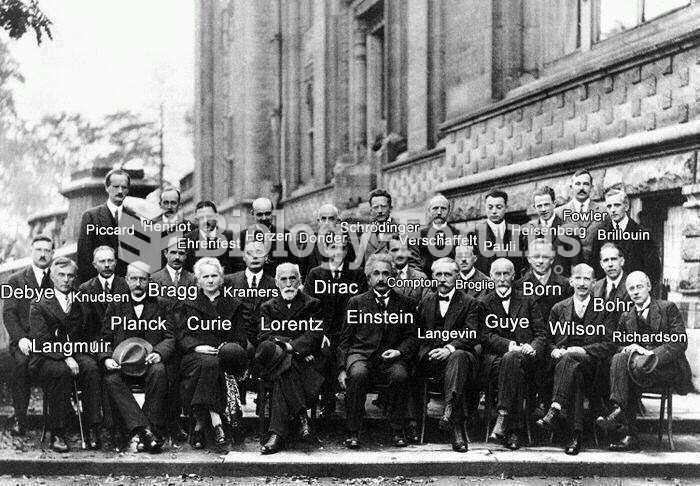 Scientists (group photo)
 Historian James Merrell notes several errors in Benjamin West’s famous 1771 painting, William Penn’s
 Basic Food Group Choices for a 1,200 Calorie Eating Plan
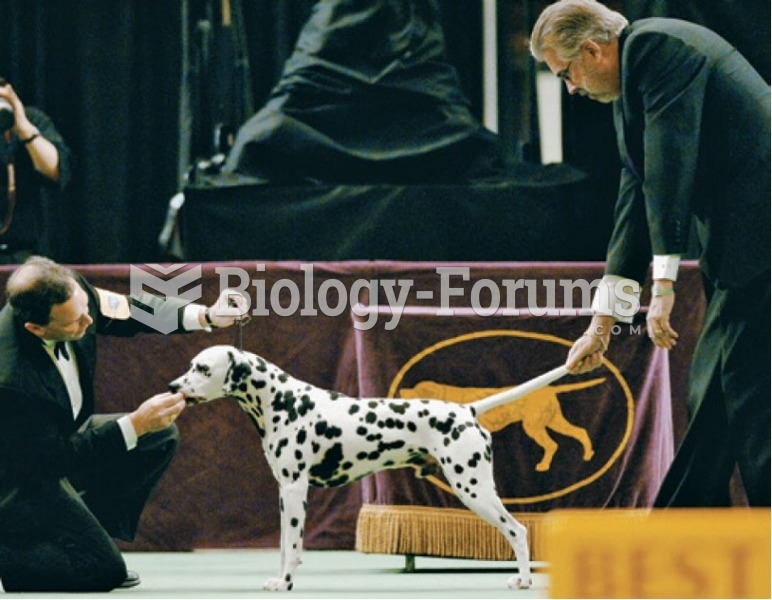 What are examples of ideal forms?
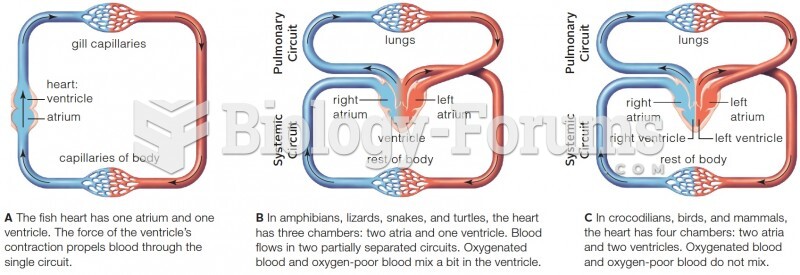 Variation in vertebrate circulatory systems