|
|
|

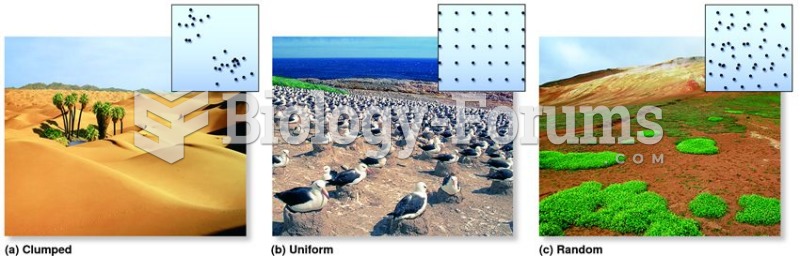 Three types of dispersion.
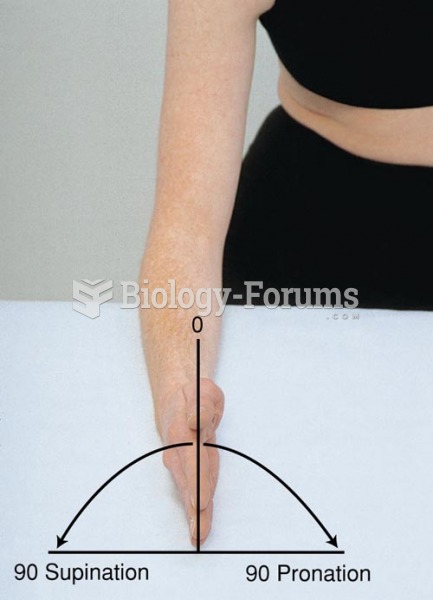 Range of Motion of the Elbow Joint, Supination, Pronation
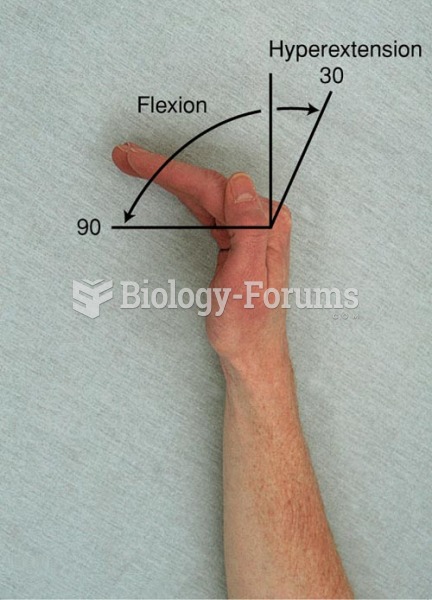 Range of Motion of the Wrist and Hand Joints, Flexion and Hyperextension of the Fingers
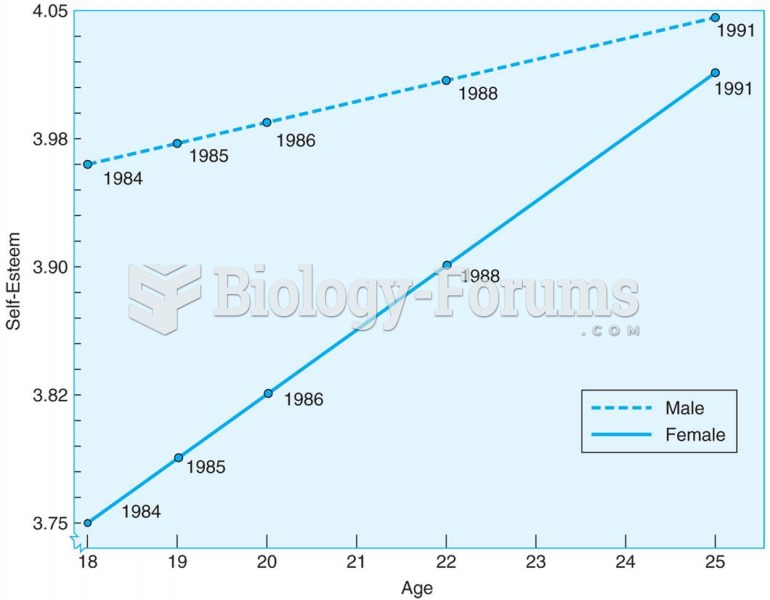 Young adults increase in self-esteem between the ages of 18 and 25, according to this longitudinal s
 Acquiring Weather Data
 Business Intelligence, Analytics, and Data Science: A Managerial Perspective, 4th Edition