This topic contains a solution. Click here to go to the answer
|
|
|

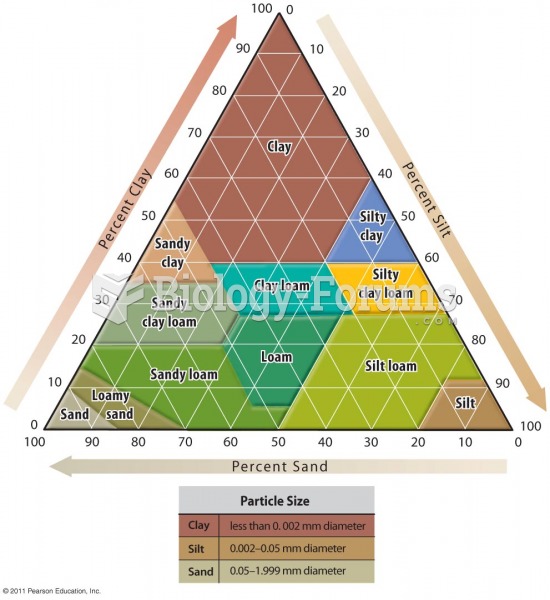 Soil Texture Diagram
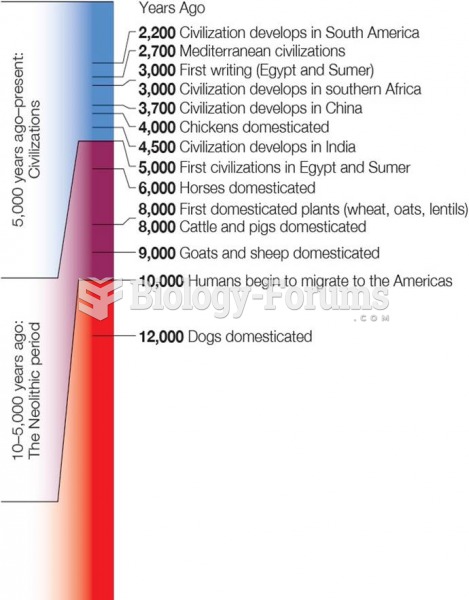 Time Line of Human History From Upper Paleolithic Period to the Present
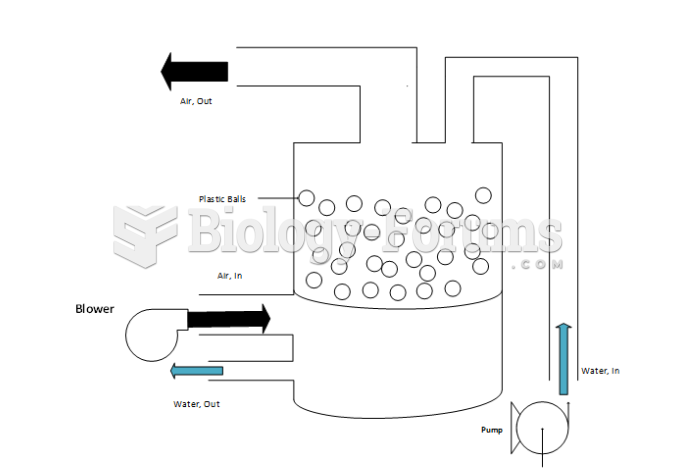 Schematic Diagram of the fluidized bed for the experiment (CHE415 Unit Operations)
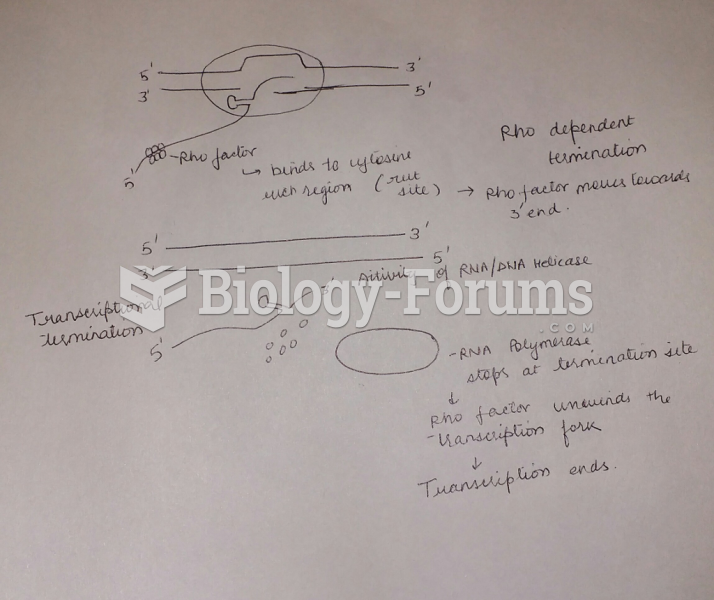 Draw and label a diagram and explain how a factor-dependent transcription (rho-dependent) terminator
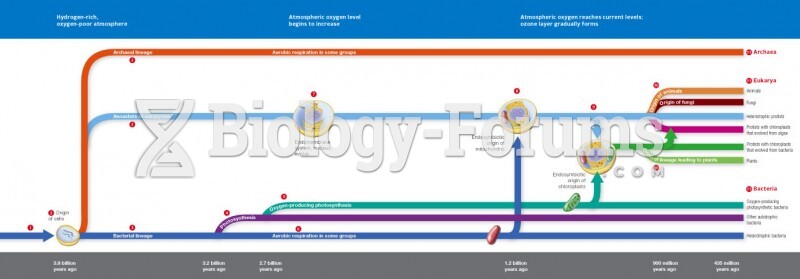 Time Line for Life’s Origin and Evolution