This topic contains a solution. Click here to go to the answer
|
|
|

 Greater Flamingo
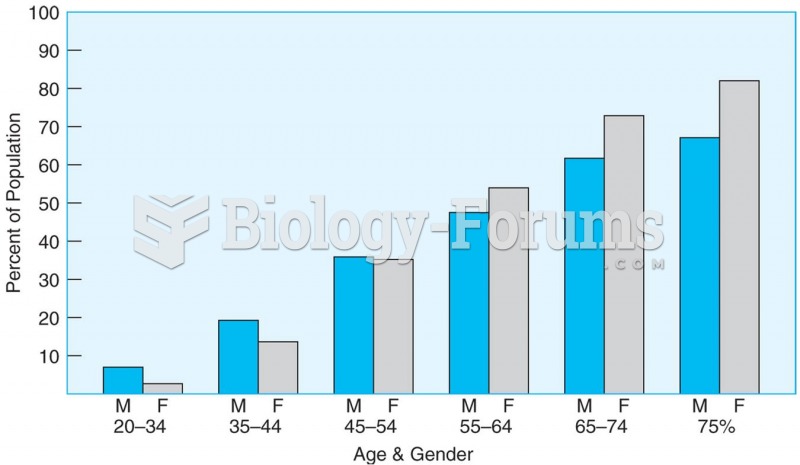 The proportion of men and women with elevated blood pressure or taking hypertension medication incre
 Example of an approximately 37,500 probespotted oligo microarray.
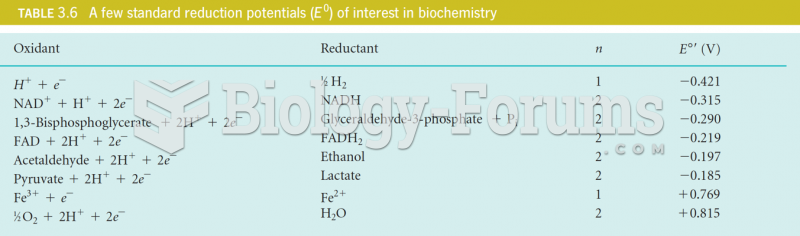 standard reduction potential (Eo), the greater the tendency of the oxidized form of a redox couple
 Approximately 40 percent of farmers in the United States are 55 years old or older
 Mendel’s Observations for Seven Monohybrid Traits in the F1 and F2 Generations