|
|
|

 Major moons of Uranus in order of increasing distance (left to right), at their proper relative size
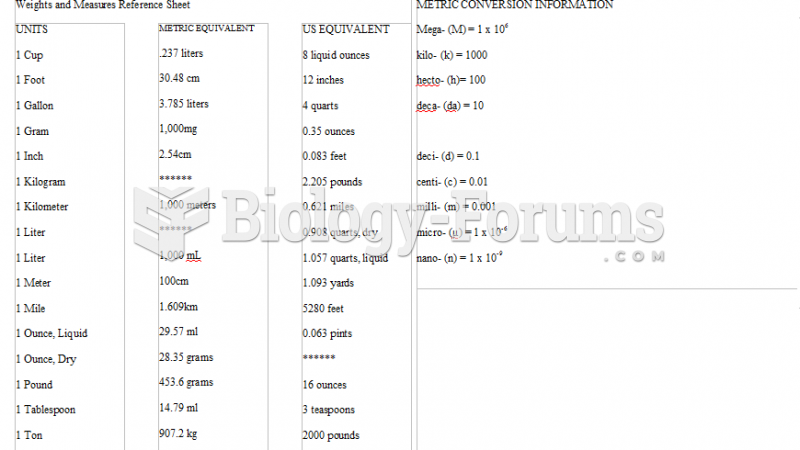 Conversion Chart
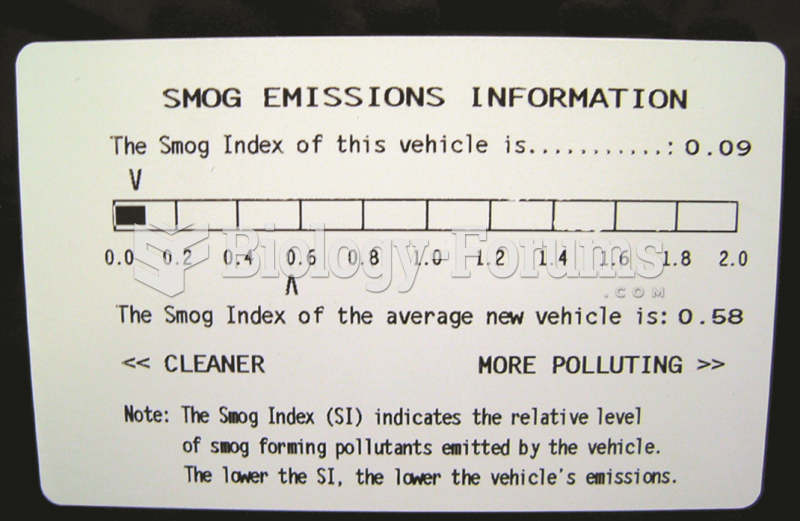 This label on a Toyota Camry hybrid shows the relative smog-producing emissions, but this does not ...
 Chart
Chart
 How to plot a sine function containing an amplitude and phase-shift (Question 2 of 3)
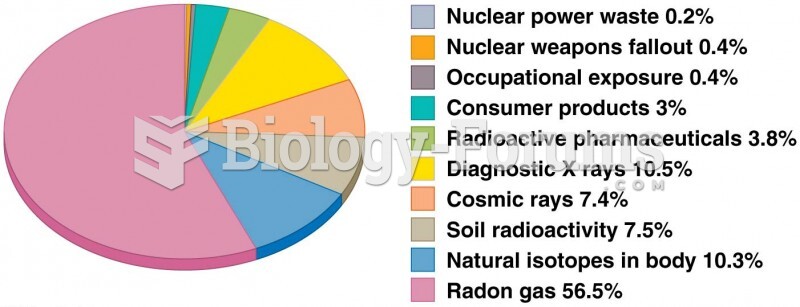 Chart showing average yearly dose of radiation from natural and human-made sources