|
|
|

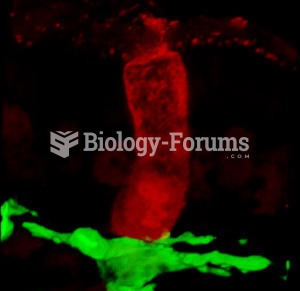 Goblet cells that line the intestine
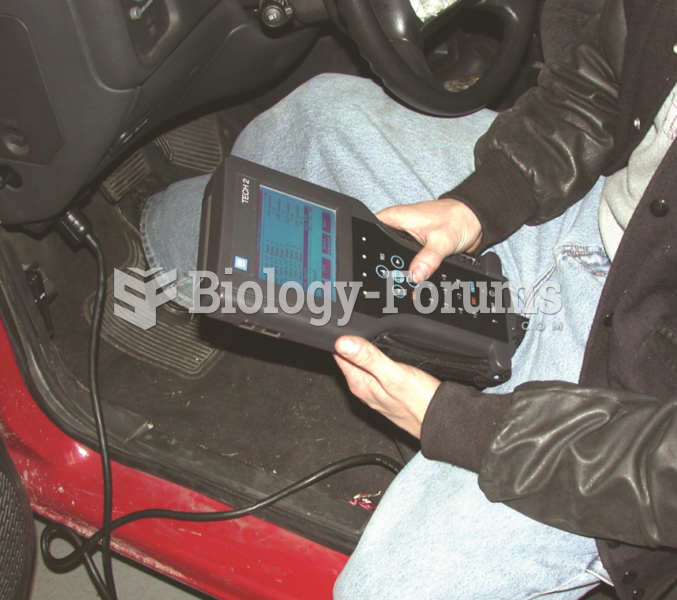 Using a scan tool to check for IAC counts or percentage as part of a diagnostic routine.
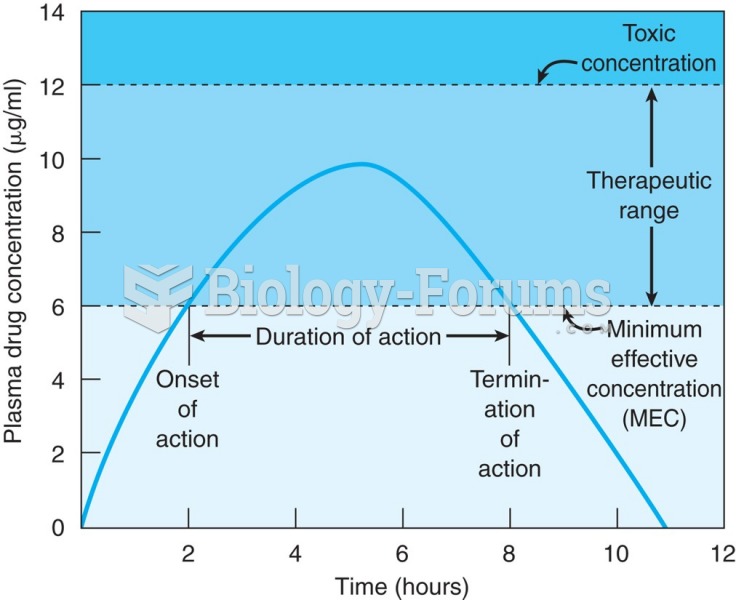 Graph showing oral administration of a single-dose drug. The time of onset is 2 hours and the end of ...
 How to find the equation of a line that is perpendicular to a line passing through a point
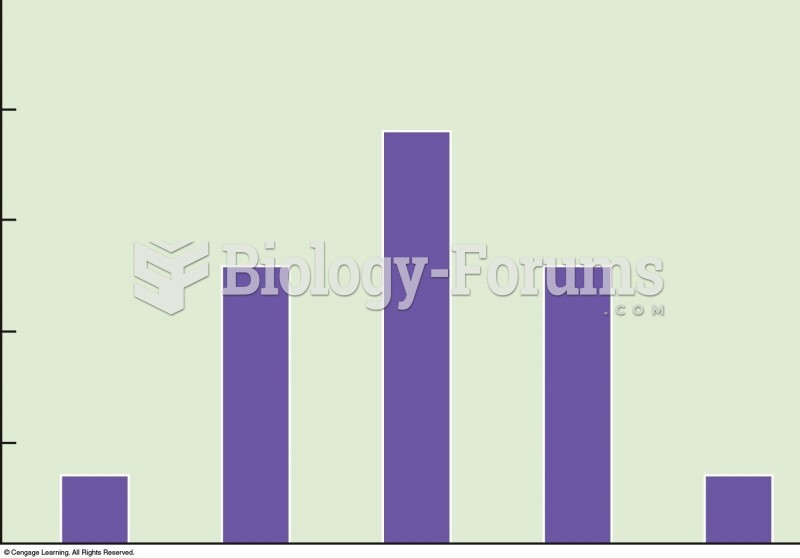 Frequency distribution of phenotypes from the possible offspring in Figure 5.7. Height of the offspr
 What is the frequency of individuals that are homozygous for this allele?