|
|
|

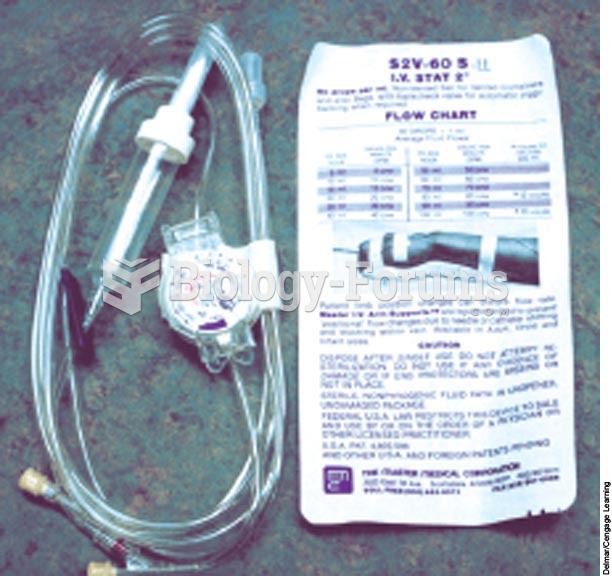 Dial-A-Flo in-line device to regulate IV flow.
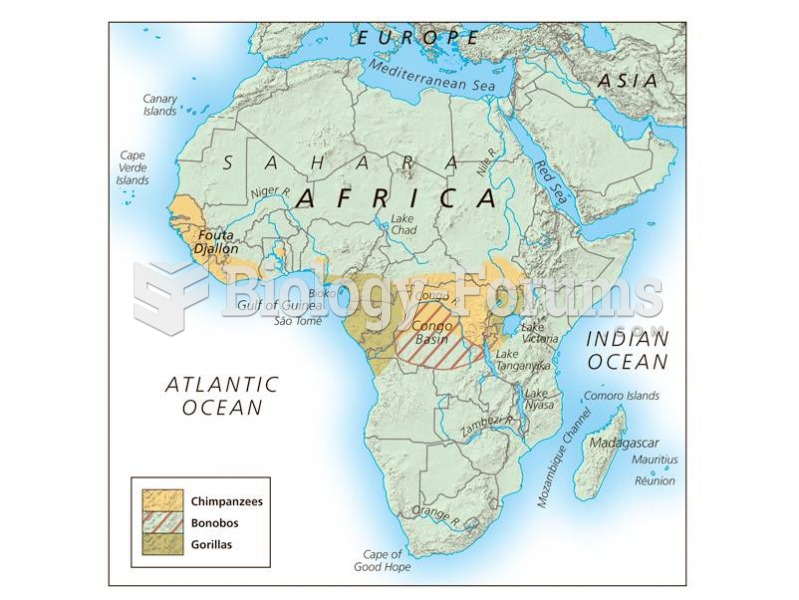 Distribution of the African great apes.
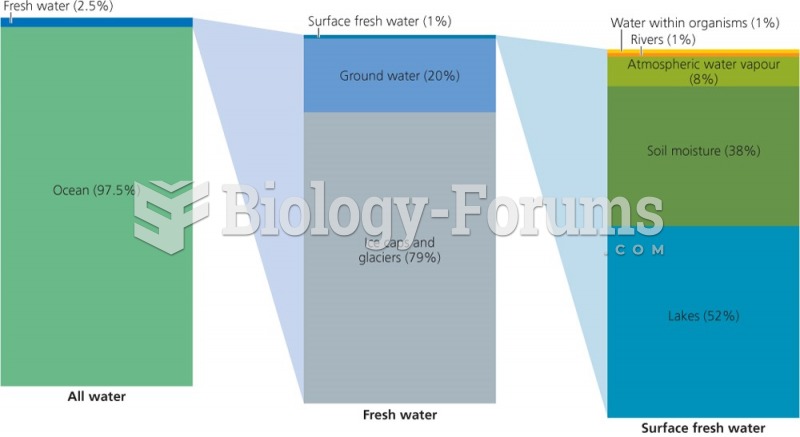 Distribution of Earth's Water
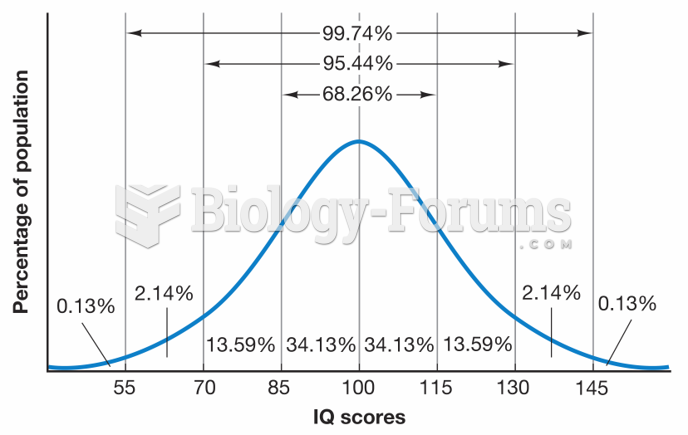 Expected Distribution of IQ Scores
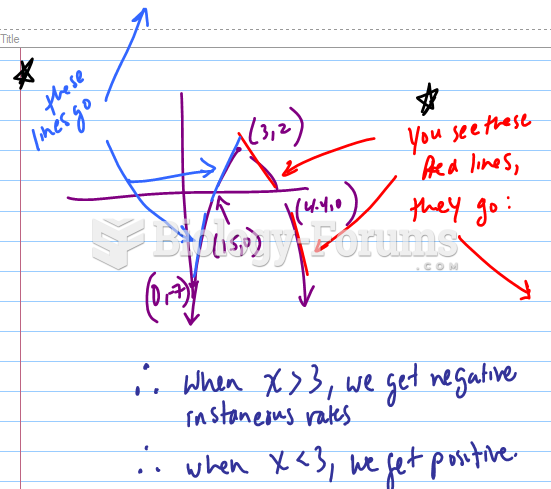 If a graph has the following x-intercepts, which value of x is the instantaneous rate of change ...
 IROC on a Graph Questions