|
|
|

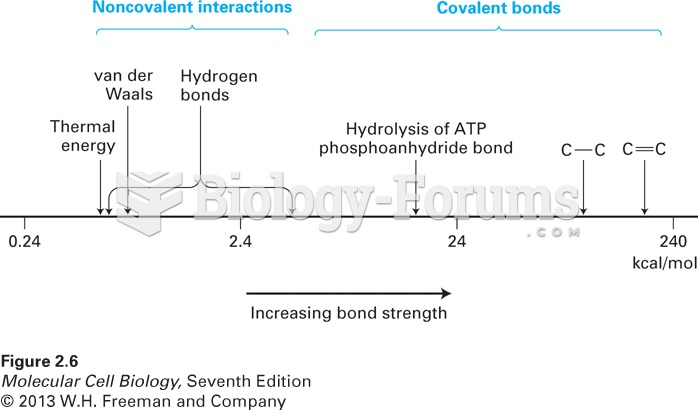 Relative energies of covalent bonds and noncovalent interactions
 Organization of Spatial Frequency
 Sociologists disagree about the relative significance of race and social class in determining social ...
 The relative penetrating power of alpha, beta, and gamma radiation. Gamma and neutron radiation are ...
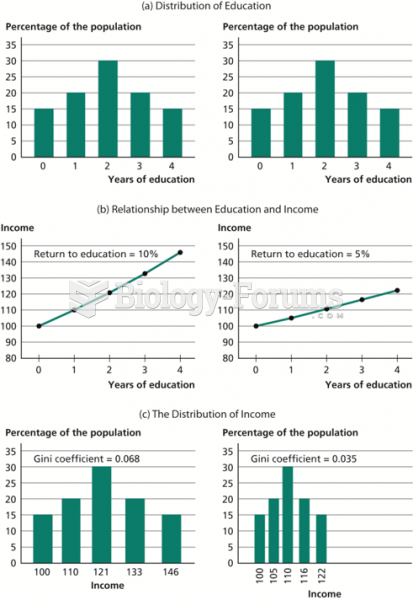 How the Return to Education Affects the Distribution of Income
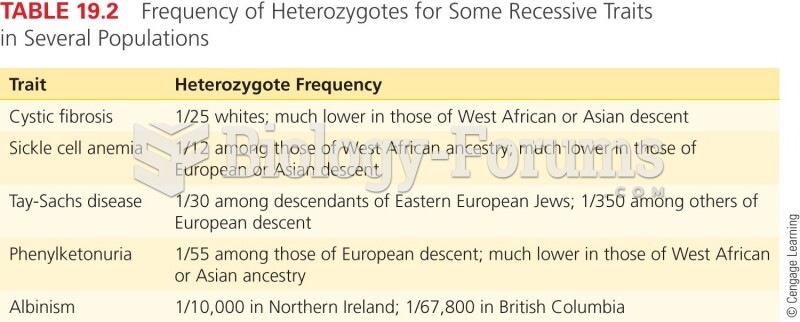 Frequency of Heterozygotes for Some Recessive Traits in Several Populations